
Terminal demographics
About a week ago, I argued that the Great Inflation of the 1970s was largely a demographic phenomenon. That claim has provoked a lot of debate and rebuttal, in the comment sections of several posts here, and elsewhere in the blogosphere. See Kevin Erdman, Edward Lambert [1, 2, 3], Marcus Nunes [1, 2], Steve Roth [1,2], Mike Sax, Karl Smith [1, 2, 3], Evan Soltas, and Scott Sumner [1, 2], as well as a related post by Tyler Cowen. I love the first post by Karl Smith. My title would have been, “Arthur Burns, Genius.”
These will be my last words on the subject for a while, though of course they needn’t be yours. To summarize my view, I dispute the idea that the United States’ Great Inflation in the 1970s resulted from errors of monetary policy, errors that wise central bankers could have avoided at modest cost. During the 1970s, the simultaneous entry of baby boomers and women into the workforce meant the economy had to absorb workers at more than double the typical rate to avoid high levels of unemployment. This influx was effectively exogenous — it was not like a voluntary migration, provoked by the existence of opportunities. Absorption of these workers required a fall in real wages and some covert redistribution to new workers, which the Great Inflation enabled.
I don’t dispute that monetary contraction could have prevented the inflation of the 1970s. But under the demographic circumstances, the cost of monetary contraction in terms of unemployment and social stability would have been unacceptably high. As a practical matter, monetary policy was impotent, and would have been even if Paul Volcker had sat in Arthur Burns’ chair a decade earlier. I am perfectly fine with Evan Soltas’ diplomatic rephrasing of my position, that perhaps inflation remained a monetary phenomenon, but that the 1970s generated a “worse trade-off [for policymakers that] was not a monetary phenomenon”. I don’t claim that monetary policy was “optimal” during the period. Policy is never optimal, and in an infinite space of counterfactuals, I don’t doubt that there were better paths. But I do think it is foolish to believe that the policy decisions of the early 1980s would have had the same success if attempted during the 1970s. Monetary contraction was tried, twice, and abandoned, twice, in the late 60s and early 70s. There was and is little reason to believe that just holding firm would have successfully disinflated at tolerable cost in terms of employment and social peace. I don’t claim that demographics was the only factor that rendered disinflation difficult. With Arthur Burns (ht Mark Sadowski) and Karl Smith, I think union power may have played a role. It also mattered, again with Smith, that “unemployment was poisonous to the social fabric and the social fabric was already strained, most notably by race relations”. Monetary contraction succeeded — third time’s the charm! — when the demographic onslaught was subsiding, when Reagan cowed the unions, when the country was at relative peace. It might not have been practical otherwise.
I’ve had a wonderful nemesis and helper the last few days in commenter Mark Sadowski, who challenged me to provide evidence for a demographic effect on inflation in international data. Mostly I made a fool of myself (twice actually, and not unusually). Looking at the graphs — after Sadowski helped me get them right! — I see support for a relationship between labor force demographics and inflation in the United States, Japan, Canada, and Finland. Italy is a strong counterexample — it disinflated in the middle of its labor boom. The rest you can squint and tell stories about. (I now have 14 graphs now.) Italy notwithstanding, the claim “it’s hard to disinflate when labor force growth is strong” looks more general than “inflation correlates with labor force growth”. Decide for yourself.
Sadowski is not much impressed by my demographic view of the Great Inflation. But he paid me the huge compliment of devoting time and his considerable expertise to testing my speculations. He writes
I took your set of eight nations plus the four from my original set of counterexamples that you excluded (West Germany, Ireland, Luxembourg and the Netherlands), combined civilian labor force data from the OECD with CPI from AMECO, and computed 5-year compounded average civilian labor force growth rates and CPI inflation rates. The time periods ran from 1960-65 through 2007-12.
Then I regressed the average CPI inflation rates upon the average labor force growth rates. Five of the twelve were statistically significant, and all at the 1% level. The average civilian labor force growth rate and average CPI inflation rate were positively correlated in the U.S. and Japan, and negatively correlated in Spain, the Netherlands and Luxembourg.
Next I conducted Granger causality tests using the Toda and Yamamato method on the level data over 1960-2012 for the U.S., Japan, Spain, the Netherlands and Luxembourg.
The U.S. data is cointegrated, so although the majority of lag length criteria suggested using only one lag, since Granger causality in both directions was rejected at a length of one, I went to two lags based on the other criteria. The results are that CPI Granger causes civilian labor force at the 10% significance level but civilian labor force does not Granger cause CPI.
In Japan’s case civilian labor force Granger causes CPI at the 1% significance level but CPI does not Granger cause civilian labor force.
Granger causality was rejected in both directions for the other three countries.
In short, out of the 12 countries I looked at, only five have a significant correlation between average civilian labor force growth and average CPI inflation, and only two of five have a positive correlation. Of the five, only the two with positive correlation demonstrate Granger causality. But in the US case the direction of causality is in the opposite direction to that which you predict. Only Japan seems to support the kind of story you are trying to tell.
and follows up
I added your set of seven new nations (Canada, Finland, Greece, Italy, New Zealand, Switzerland and Turkey) plus seven additional nations (Belgium, Denmark, Iceland, Korea, Norway, Poland and Portugal) to the set of 12 that I commented on last time. I did the same analysis as I did last time for this new set of 14, that is I combined civilian labor force data from the OECD with CPI from AMECO, and computed 5-year compounded average civilian labor force growth rates and CPI inflation rates. The time periods ran from 1960-65 through 2007-12 with the exception of Korea which started with 1967-72. I regressed the average CPI inflation rates upon the average labor force growth rates. Ten of the fourteen were statistically significant, and all at the 1% level with the exception of Poland which was at the 10% significance level. The average civilian labor force growth rate and average CPI inflation rate were positively correlated in Canada, Denmark, Finland, Greece, Iceland, Italy, Korea, New Zealand and Norway and negatively correlated in Poland.
Next I conducted Granger causality tests using the Toda and Yamamato method on the level data over 1960-2012 (except for Korea which was over 1967-2012) for the ten countries which had statistically significant correlations.
In Finland, Poland and Korea civilian labor force Granger causes CPI at the 5% significance level but CPI does not Granger cause civilian labor force. In Greece CPI Granger causes civilian labor force at the 1% significance level but civilian labor force does not Granger cause CPI. In Iceland CPI Granger causes civilian labor force at the 10% significance level but civilian labor force does not Granger cause CPI.
So out of the 26 countries I have looked at, fifteen have a significant correlation between average civilian labor force growth and average CPI inflation with eleven of the fifteen having a positive correlation. Of the eleven with positive correlation six demonstrate Granger causality with three showing one way causality from civilian labor force to CPI and three showing one way causality from CPI to civilian labor force. Of the four with negative correlation one demonstrates Granger causality from civilian labor force to CPI.
Only three countries (Japan, Korea and Finland) out of the 26 support the kind of story you are trying to tell.
Mostly I am very grateful to Sadowski for his work.
Alas, I am not at all dissuaded from my view. At the margin I’m even a bit encouraged. The direction of Granger causality is not very meaningful here. (Granger causality, in the econometric cliché, is not causality at all but a statement about the arrangement of correlations in time. Expectations matter and near-future labor force growth is easy to predict, so there’s no problem if CPI changes can precede labor force changes.) I see some support for my thesis in the significant and usually positive correlations Sadowski observes in many countries. However, much as I am grateful, I don’t take this work as strong evidence either way. Sadowski overflatters my graphical analysis technique by translating it directly to an empirical model. Collapsing growth into overlapping 5-year trailing windows smooths out graphs that would otherwise just look like choppy tall-grass noise. But it creates a lot of autocorrelation unless the data is chunked into nonoverlapping periods. (Sadowski may well have done that! It’s not clear from the write-ups.) More substantively, to generate a good empirical model we’d have to think hard about other influences and controls that should be included. One wouldn’t model inflation as always and everywhere a univariate function of domestic labor force growth.
Maybe my view has been definitively refuted and I’m just full of derp! You’ll have to judge for yourself. In any case, I thank Sadowski for the work and food for thought, and for help and correction as I made a fool of myself.
I want to address some smart critiques by Evan Soltas:
Consider a standard Cobb-Douglas production function: Y = zKαLβ. Consider a large and sustained shock to L, as Waldman shows. Consider, also, that the level of K has some rigidities, such that the level of K is not always optimal given the level of L, but that in a single shock to L, K will eventually approach the optimal level of K over some lag period. With this background, the marginal productivity of labor should drop and remain low over that lag period.
Now assume that real wages tend towards the marginal productivity of labor with a lag. What we should expect to see is that real wages should drop in the 1970s. Why? Surplus labor reduces the bargaining power of workers relative to that of employers. We don’t see that; real wages begin to fall after monetary policy tightens in the 1980s. My Cobb-Douglas model is also a bit limiting, but if anything, we might expect to see downward pressures on the labor share of income β. We don’t see that either — as compared to later periods, the 1970s appears to be a time of slightly stronger labor-share performance.
Under Soltas’ nice description of what I’ll call the “first order” effects of a demographic firehose, we should indeed expect real wages to fall relative to an ordinary population growth counterfactual. Did they? Yes, I think so. Let’s graph a few series.
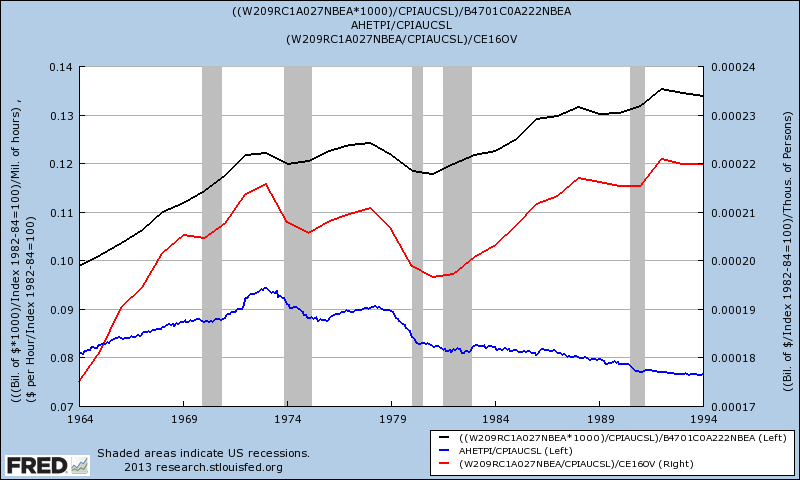
The blue line is one of the series that Soltas graphed, CPI-adjusted hourly wages of nonsupervisory employees. They fell during the course of the 1970s in absolute terms. The black line is the broadest measure of hourly compensation I could compute, CPI-adjusted employee compensation divided by hours worked. It is essentially flat over the course of the decade, breaking a strong prior uptrend. The red line is CPI-adjusted compensation per employee. It fell in absolute terms over the decade.
Soltas suggests that compensation did not fall based on a graph of CPI-adjusted average manufacturing sector hourly wage, which rose over the 1970s. But manufacturing was simply an unrepresentative sector. (Those unions again?)
Overall, I think it’s fair to say that real wages did fall. They certainly fell relative to the prior trend, and probably in absolute terms. Still, looking at that black line, you might say they fell a bit less or more slowly than you might expect. More on that below.
Soltas also points to a strong labor share during the 1970s as disconfirmative, but that’s hard to interpret. Under the “first-order” demographic firehose story, we expect real wages per unit of labor to fall, but the number of units paid to increase. Which effect would dominate would depend on details of the production function. (It’s not clear that labor share was strong in the 1970s. Labor share seems to have declined over the decade from unusually high levels in the late 1960s.)
Let’s continue see the rest of Soltas’ critique:
Let’s simplify. Waldman’s thesis, stated uncharitably, is that a large increase in the labor supply acted as an inflationary pressure on the economy of the 1970s. I don’t see how that works. Show me the model. Less uncharitably, it forced a worse trade-off on the Fed, specifically forcing higher unemployment or higher inflation. I don’t see how that works, either. Unemployment might have been higher, but that would have put a deflationary pressure on the central bank, all else equal, given the exogenous surge in the labor supply.
Think about it this way: Whatever the Fed of the 1970s did in monetary policy, it faced an unstoppable surge in the labor supply. That should be a tremendous headwind against wage increases and broader inflation. You can argue that the capital stock wasn’t ready for the higher labor supply, and I would grant that point, but that should translate into a downward pressure on wages, not an upward pressure on inflation. It’s not an adverse supply shock.
Now we come to the “second order” story.
The piece of the model that Soltas isn’t seeing is rigidity. First, there is that most conventional rigidity, nominal wage stickiness. If real wages must decline for the labor market to clear, but nominal wages are sticky downward, then the only way to avoid unemployment is to tolerate inflation.
But in addition to nominal rigidities, there are real rigidities. All those kids in the 1970s graduating high school or college and entering the labor force had expectations about the kinds of lives they should be able to live when they got a job. They would not have been satisfied with increasing dollar wages, if those dollars could not support starting lives and families of their own, independent of Mom and Dad. Middle class labor force entrants then expected to be able to support a home, a car, even start a family on a single income.
Rigidities aren’t forever. Those expectations have evaporated over the past 40 years. That is the famous Two Income Trap, under which the necessities of “ordinary life” as most Americans define it now require two, rather than just one, median earner. But Rome wasn’t destroyed in a day. Baby boomers entered the labor force with real expectations. They were not mere price takers. But the declining marginal productivity in Soltas’ Cobb-Douglas production function meant boomers could not earn sufficient real wages to meet those expectations in a hypothetical perfect market. They faced precisely a supply shock [1], arising from each boomer’s own diminished capacity to supply relative to prior cohorts, for reasons entirely beyond their control. They would not be very happy about it. A tacit promise would have been broken.
To avoid social turmoil, the political system had to find ways of not disappointing the budding boomers’ expectations too abruptly. That implied some redistribution, from older workers and capital holders to new workers. Among other things, inflation can be a means of engineering covert redistributions. This is the part, I think, that puzzles Scott Sumner. High inflation reduces the real purchasing power of people living off of interest, and of people already employed who are slow or lack bargaining power to negotiate raises. That foregone purchasing power liberates supply, which becomes available to subsidize the real wages of the newly employed. Real GDP did not collapse during the 1970s, but the inflation created losers. The share of production that losers lost went to someone. I think that, among other mischief, it helped subsidize the employment of new workers at real wages below but not too far below what the generation prior had enjoyed.
We’ve seen that Arthur Burns was a genius, but I don’t think that any of this was conscious strategy. Like most real-world policymakers, Burns felt his way towards the least painful solution, then used his considerable intellect to justify what he found himself doing. When Burns tightened money, unemployment rose sharply and Greg Brady got mad that the jobs he was refusing wouldn’t pay enough to cover wheels and a pad across town from his annoying sisters. He started to smoke dope, get into politics, frighten his parents and neighbors. (We won’t even talk about J.J and the Panthers.) When money was loose and inflation roared, times were bad for everyone, which helped ease the sting. Greg’s job offers still paid less in real terms than he’d have hoped, but the money illusion made the numbers sound OK, and he could stretch the salary to move away, albeit into a smaller place than he had hoped. Carol and Mike breathed a sigh of relief, as did their congressman, Richard Nixon, and Arthur Burns.
If you’ve read all of this, there is something terribly wrong with you. I thank you nonetheless. As I said at the start, this will be my last episode of “That ’70s Show”, at least for a while. (Thanks @PlanMaestro!) I want to move on to other things. Do feel free to have the last word, in the comments or elsewhere.
[1] More abstractly, fix the median new worker’s market clearing real wage as our numeraire. Prior to a population boom, the median new worker supplies her labor for a particular bundle of goods and services. But in the population boom, because of the diminishing marginal productivity of labor (holding K constant), the median new worker cannot produce enough in real terms to purchase the same bundle. The worker’s demand curve has not changed at all: she remains willing to trade one unit of salary for one unit of consumption bundle, just as her predecessor did. But that trade is no longer available to her, because she herself is unable to supply real production in sufficient quantity to purchase those goods, despite expending her fullest effort. This is a supply shock, from the worker’s perspective, not a demand shock. The population boom is a shock to her ability to supply, which would be reflected by inflation of the cost of goods relative to the numeraire of her labor.
Update History:
- 11-Sept-2013, 1:55 p.m. PDT: “
Congressmancongressman“; “her fullestlesseffort”; Also, a while back, corrected (again) my persistent misspelling Sadowski’s name “SandowskiSadowski“
Steve,
My last name is still not spelled with an “n”. (See paragraphs four and five.)
P.S. “Sadow” (pronounced “sadov”) means “orchards” in Polish if it helps you remember any better.
P.P.S. I’m often tempted to add another “n” to your last name thanks to Robert Waldmann. So I theorize for some odd reason you are compelled to give my last name the “n” that I think your last name is missing.
September 10th, 2013 at 9:53 am PDT
link
“Sadowski overflatters my graphical analysis technique by translating it directly to an empirical model. Collapsing growth into overlapping 5-year trailing windows smooths out graphs that would otherwise just look like choppy tall-grass noise, but creates a lot of autocorrelation unless the data is chunked into nonoverlapping periods. (Sadowski may well have done that! It’s not clear from the write-ups.)”
To be clear I only calculated the correlations of 5-year trailing windows because of your graphs. If they had significant correlations then I checked them for Granger causality. This is not as systematic as it could be but I don’t think going any further will yield more positive results for Granger causality. In the Granger causality tests themselves I used the original level data and added extra lags as necessary to correct for non-stationarity in the manner prescribed by Toda and Yamamato.
September 10th, 2013 at 10:29 am PDT
link
I think the time is ripe for a reevaluation of Burns’s legacy and the monetary history of the ’70s. The experience of the past few years has shown us that perhaps the omnipotence of the Fed is not all that it was supposed to be. In the face of unusually difficult circumstances, the Fed may find itself choosing from a menu of unpalatable options. Surely Burns is correct in his assessment that monetary policy is a blunt instrument – like trying to solve an evolving multi-dimensional optimization problem by turning a single knob. In the same way that Burns may have been underrated, perhaps the wisdom of those who presided over the “Great Moderation” may have been overrated. There may have been larger macroeconomic forces at play that made possible a long period of acceptable employment with low inflation.
September 10th, 2013 at 11:33 am PDT
link
“I don’t dispute that monetary contraction could have prevented the inflation of the 1970s. But under the demographic circumstances, the cost of monetary contraction in terms of unemployment and social stability would have been unacceptably high. As a practical matter, monetary policy was impotent, and would have been even if Paul Volcker had sat in Arthur Burns’ chair a decade earlier.”
The key to understanding the Great Inflation is the fact that unemployment was never significantly higher than the Natural Rate of Unemployment (NROU) from 1963Q3 through 1974Q2, and it was usually significantly lower than it, falling as low as 3.4% in 1968Q4 through 1969Q2 at a time when NROU was 5.8% :
https://research.stlouisfed.org/fred2/graph/?graph_id=136476&category_id=0
Core inflation started accelerating in late 1965 rising from 1.2% on average during 1964Q3 through 1965Q2 to 5.0% in 1970Q3 through 1971Q2.:
https://research.stlouisfed.org/fred2/graph/?graph_id=136482&category_id=0
But notice that despite the fact unemployment remained below NROU after 1971Q2, inflation fell. Why is that?
Nixon imposed wage and price controls in 1971Q3. During Phase 1 and 2, which lasted through the end of 1972, core inflation only averaged 3.1%. During Phase 3 in 1973Q1 and 1973Q2, which relaxed the wage and price controls, core inflation rose to an average of 4.2%. Phase 4 further relaxed wage and price controls and lasted through 1974Q1. During this time unemployment fell to 4.8% at a time when NROU was 6.2%.
Core inflation averaged 6.1% during Phase 4, and given the unemployment rate that is likely what the underlying core inflation rate had risen to. Furthermore there was pent up wage and price catching up to do as for two years inflation had averaged only 3.4% when the underlying core inflation rate had likely been well above 5%. Thus when wage and price controls were lifted in April 1974 core inflation immediately surged and averaged 10.1% in 1974Q2 through 1975Q1.
The 1963-74 period is unparalleled in peacetime American history in terms of labor market tightness, which caused the Phillips Curve to steadily rise during this time. The Great Inflation only seems to be a mystery because the NROU also rose steeply during this period, primarily due to demographic factors, and this concealed the extent and duration of this tightness. The Nixon wage and price controls and the energy crisis only serve to muddy the waters further.
The recovery from the 1974-75 recession was fairly swift with unemployment falling from 8.9% in 1975Q2 to just a hair above the 6.3% NROU in 1978Q1:
https://research.stlouisfed.org/fred2/graph/?graph_id=136573&category_id=0
And note that unemployment fell below NROU from 1978Q2 through 1979Q4.
Core inflation averaged 6.3% from 1975Q2 through 1978Q1, but rose to an average of 7.7% in the four quarters of 1979:
https://research.stlouisfed.org/fred2/graph/?graph_id=136574&category_id=0
Offhand it’s hard to say what the underlying core inflation had risen to during the wage and price controls but it was probably driven down during the recovery from the 1974-75 recession and it evidently was driven higher again during the relative “boom” of 1978-79.
In the Orphanides paper that Karl Smith points to we find evidence that the Fed overestimated potential GDP during this time. Suppose instead we had “optimal” monetary policy with the unemployment rate kept near NROU instead of falling far below it as it did for nearly all of 1963-74. Then core inflation might not have risen from 1.2% in 1964-65 to 10.1% in 1974-75. Yes unemployment would have been 5.8% instead of 3.4% in 1969-70, and over 6% from 1971 on, but core inflation would have remained low.
September 10th, 2013 at 11:52 am PDT
link
Evan Soltas:
“My Cobb-Douglas model is also a bit limiting, but if anything, we might expect to see downward pressures on the labor share of income β. We don’t see that either — as compared to later periods, the 1970s appears to be a time of slightly stronger labor-share performance.”
The Compensation of Employees (COE) rose from less than 62% of National Income (NI) during most of 1963-65 to nearly 67% by 1970Q1. It would remain around 65-68% for the entire 1970s setting its quarterly and annual records in 1980. The following graph is the COE share of NI graphed alongside the gap between NROU and the unemployment rate such that positive means unemployment is below NROU:
https://research.stlouisfed.org/fred2/graph/?graph_id=136584&category_id=0
This is another piece of evidence that labor markets were incredibly tight in the mid to late 1960s, and not particularly loose in the 1970s.
September 10th, 2013 at 12:16 pm PDT
link
“It’s not clear that labor share was strong in the 1970s. Labor share seems to have declined over the decade from unusually high levels in the late 1960s.”
Both the University of Groningen (UG) and the BLS data need to be taken with grains of salt.
The UG data is taking the ratio of labor compensation to GDP. Labor compensation is an income measure and GDP is an production/expenditure measure. In theory both GDP and GDI should be equal but in practice there is a statistical discrepancy. Furthermore Compensation of Employees (COE) is a national measure and not a domestic measure, so there is another small discrepancy. And finally, and most importantly, depreciation surged during the 1970s which would bias the change in labor share of income downward. To give you an idea of how serious these issues are here is the ratio of National Income (NI) to GDP:
http://research.stlouisfed.org/fred2/graph/?graph_id=136599&category_id=0
Note that the ratio of NI to GDP fell from 87.4% in 1970 to 84.8% in 1980. Thus for these reasons it makes more sense to take the ratio of COE to NI.
Similarly, I’m skeptical of the BLS data. First of all it’s the Business Sector and not the entire economy. Secondly I’m not sure if they are deflating the data consistently. In fact when Gali and Gertler estimated their New Keynesian Phillips Curve in 2000:
http://www.nber.org/papers/w7551
They used labor share as an instrument, and used BLS data to compute labor share for the Nonfarm Business Sector. But rather than using the BLS Nonfarm Business Sector Labor Share they computed it from raw BLS compensation and output data and subjected it to a transformation that involved deflating it by the GDP implicit price deflator. The exact formula may be found in a paper by Nason and Smith (2008):
http://www.richmondfed.org/publications/research/economic_quarterly/2008/fall/pdf/nason_smith.pdf
Here is the Gali and Gertler labor share series graphed alongside the BLS Business and Nonfarm Business sector labor share series for comparison:
http://research.stlouisfed.org/fred2/graph/?graph_id=136600&category_id=0
I’m not sure what Gali and Gertler’s justification for doing this was, but the end result is that their series shows Nonfarm Business Sector Labor Share peaking in 1982, and it seems to more closely match the behavior of the BEA ratio of COE to NI.
September 10th, 2013 at 1:45 pm PDT
link
The utter ridiculousness of the monetarist position is turning our brains to mush with endless discussion of nonsensical minutiae. We’re left with the conclusion that monetary policy could have prevented the inflation of the 1970s by damaging the economy. This tells us nothing.
Monetary policy involves the setting of interest rates and that is all. To say that the macro-economy can or should be managed through this one tool is not reasonable. We could just as well say that the inflation of the 1970s could have been prevented by raising taxes, or decreasing public expenditures, or wage and price controls, or breaking OPEC, etc. Interest rates (monetary policy) are just one factor in the macroeconomic picture, and a relatively insignificant one at that. There are a lot of factors you can screw around with…
September 10th, 2013 at 4:18 pm PDT
link
Detroit Dan,
“Monetary policy involves the setting of interest rates and that is all.”
The Traditional Interest Rate Channel is only one of the nine channels of the Monetary Transmission Mechanism (MTM) as enumerated by Frederic Mishkin.
The following paper by Mishkin gives an overview of the MTM:
http://myweb.fcu.edu.tw/~T82106/MTP/Ch26-supplement.pdf
You might find the following table, found in the author’s best selling intermediate monetary economics textbook useful:
http://www.econbrowser.com/archives/2008/01/mishkin1.jpg
“We could just as well say that the inflation of the 1970s could have been prevented by raising taxes, or decreasing public expenditures,…”
True, fiscal policy was expansionary in fiscal years 1964 through 1968. The cyclically adjusted Federal budget balance was reduced from (-0.5%) of potential GDP in fiscal year 1963 to (-4.4%) in fiscal year 1968, and the deficit was increased annually during that time:
http://www.cbo.gov/sites/default/files/cbofiles/attachments/43977_AutomaticStablilizers3-2013.pdf
But a 10% income surtax was enacted in 1968 and remained effective through 1970. The cyclically adjusted budget balance rose to (-1.1%) by fiscal year 1970 and remained in the relatively narrow range of (-2.7%) to (-1.3%) from fiscal year 1971 through 1982. In fact despite the image of a deficit prone decade the 1970s were one of the most fiscally responsible decades on record with gross Federal debt setting a post WW II record low of 32.5% of GDP in fiscal year 1981 (President Carter’s last budget).
“…or wage and price controls,…”
Wage and price controls were in effect from 1971Q3 through 1974Q1, and core inflation did fall from an average of 5.0% in the year before they were implemented to 3.1% during Phases 1 and 2. But as they were relaxed it bounced back up. During Phase 3 and 4 it reached 4.2% and 6.1% respectively. And in the year after they were ended core inflation averaged 10.1%. Wage and price controls interfere with relative price adjustments ensuring they will be abandoned and that aggregate inflation will return with some catch up inflation to boot.
“…or breaking OPEC, etc.”
Total energy expenditures as a percent of GDP rose from 8.0% in 1970 to 13.7% in 1980, a change of 5.7 points.
http://www.eia.gov/totalenergy/data/annual/pdf/sec1_13.pdf
The EIA doesn’t have total energy expenditure data from before 1970 but the price of crude petroleum in 2005 dollars was $4.46 per barrel according to the World Bank dataset and this was less than in any year in 1960-69 and was down from 26.6% from its price of $6.08 a barrel in 1965:
http://econ.worldbank.org/WBSITE/EXTERNAL/EXTDEC/EXTDECPROSPECTS/0,,contentMDK:21574907~menuPK:7859231~pagePK:64165401~piPK:64165026~theSitePK:476883,00.html
So chances are very good that total energy expenditures in 1970 as a percent of GDP had fallen from the level they had been in 1965 and yet core inflation had had already risen from 1.3% in 1965 to 4.7% in 1970, and continued to accelerate reaching 9.2% in 1980:
http://research.stlouisfed.org/fred2/graph/?graph_id=109579&category_id=0
In contrast total energy prices as a percent of GDP rose from 5.9% in 1999 to 9.9% in 2008, an increase of 4.0 points, and yet core inflation only rose from 1.3% to 2.3%.
So in the Great Inflation a change in total energy expenditures of 5.7 points resulted in an increase in core inflation of 7.9 points and in the 2000s a change in total energy expenditures of 4.0 points resulted in an increase in core inflation of 1.0 points.
This shouldn’t be surprising because research shows that commodity price increases are not an important causal factor in long-term inflation:
http://www.bostonfed.org/economic/ppb/2011/ppb111.pdf
Do Commodity Price Spikes Cause Long-Term Inflation?
Geoffrey M. B. Tootell
May 2011
Abstract:
“This public policy brief examines the relationship between trend inflation and commodity price increases and finds that evidence from recent decades supports the notion that commodity price changes do not affect the long-run inflation rate. Evidence from earlier decades suggests that effects on inflation expectations and wages played a key role in whether commodity price movements altered trend inflation. This brief is based on a memo to the president of the Federal Reserve Bank of Boston as background to a meeting of the Federal Open Market Committee.”
September 10th, 2013 at 6:28 pm PDT
link
http://angrybearblog.com/2013/09/links-to-debate-on-full-employmentinflation.html
September 10, 2013
Links to debate on full employment/inflation
By Dan Crawford
Commenter Mike McOsker claims:
“I would argue that 70′s inflation was caused by oil prices…”
Which causes me to probe even deeper into why people still believe in this zombie myth.
World nominal crude oil prices can be found here:
http://econ.worldbank.org/WBSITE/EXTERNAL/EXTDEC/EXTDECPROSPECTS/0,,contentMDK:21574907~menuPK:7859231~pagePK:64165401~piPK:64165026~theSitePK:476883,00.html
The US GDP implicit price deflator can be found here:
http://research.stlouisfed.org/fred2/series/A191RD3A086NBEA
Real world crude oil prices (in 2009 dollars) fell from $7.59 a barrel in 1965 to $5.31 a barrel in 1970, or by 30.0%, and then rose to $82.99 a barrel in 1980, or an increase by a factor of 15.62. For comparison real world crude oil prices rose from $16.54 a barrel in 1998 to $97.74 a barrel in 2008, or an increase by a factor of 5.90.
However let’s look at expenditures on petroleum. Expenditures by energy source can be found here:
http://www.eia.gov/totalenergy/data/annual/pdf/sec3_11.pdf
Combine that with the GDP figures from this:
http://www.eia.gov/totalenergy/data/annual/pdf/sec1_13.pdf
And what you’ll find is the following.
Expenditures on petroleum rose from 4.6% of GDP in 1970 to 8.5% of GDP in both 1980 and 1981, or an increase of 3.9 points. For comparison expenditures on petroleum rose from 2.6% of GDP in 1998 to 6.1% of GDP in 2008, or an increase of 3.5 points.
Core inflation rose from 1.3% in 1965 to 4.7% in 1970 to 9.2% in 1980:
http://research.stlouisfed.org/fred2/graph/?graph_id=109579&category_id=0
But core inflation only rose from 1.2% in 1998 to 2.3% in 2008.
So the increases in the proportions of GDP spent on oil are virtually identical and yet core inflation did not soar in the 2000s. Thus the idea that oil prices caused the Great Inflation makes little sense to me.
Now, this raises a legitimate question, how is it that real world crude oil prices can go up nearly 16 fold and the amount spent on petroleum *less* than doubles in the 1970s, and the real world crude oil price goes up nearly 6 fold in the 2000s and the amount spent on petroleum *more* than doubles?
One issue is that *US* crude oil prices did not rise anywhere near that much in the 1970s. The real US price of oil was $14.35 a barrel in 1965, $13.52 in 1970 and $77.39 in 1980, so US crude oil prices only rose by 5.72 fold in the 1970s:
http://research.stlouisfed.org/fred2/graph/?graph_id=136738&category_id=0
Until 1979 US crude oil prices were significantly higher than world crude oil prices, and as of 1965 and 1970 imported oil represented only 19.8% and 20.7% of total oil consumption respectively:
http://www.eia.gov/totalenergy/data/annual/pdf/sec5_6.pdf
Furthermore the price of crude oil relative to the consumption price was a lot lower in 1970 than it was later.
If you take the average daily consumption figures from the link just above and multiply them by 365 you can convert them to annual averages. Then take the annual expenditures and divide them by the consumption amounts you’ll get the average consumption price of petroleum products. Then finally convert them to real prices using the GDP implicit price deflator and this is what you will find.
The real consumption price of a barrel of oil rose from $35.98 in 1970 to $85.64 in 1980 or by 138.0%. For comparison the real consumption price of a barrel of oil rose from $33.56 in 1998 to $122.34 in 2008 or by 264.5%. Thus the impact of the oil price increases on the price of a barrel of oil to the consumer was actually far worse in the 2000s than in the 1970s.
It’s interesting to note that US crude oil prices were 37.6% of the consumption price of a barrel of oil in 1970, 90.4% in 1980, 49.9% in 1998 and 75.4% in 2008. Furthermore world crude oil prices were only 14.8% of the consumption price of a barrel of oil in 1970. A weighted averaged of domestic and world crude oil prices suggests that in 1970 crude oil prices were only about one third of the consumption price of a barrel of oil in 1970.
September 11th, 2013 at 2:15 pm PDT
link
“To avoid social turmoil, the political system had to find ways of not disappointing the budding boomers’ expectations too abruptly. That implied some redistribution, from older workers and capital holders to new workers. Among other things, inflation can be a means of engineering covert redistributions. This is the part, I think, that puzzles Scott Sumner.”
The law of hegemony!
Steve I don’t think you want to go down this path.
But ok, so the Boomers were given some inflation in the 1970’s.
So then, you’d have to admit, in the 1980’s they were given Reaganomics. My Opus poster with his Basic Union Busting textbook hung on my wall in middle school.
Then in 1990’s “we” “gave” them the era of Big Govt. is over, and fattened IRAs, but in 2000 it slipped away.
And then in the last decade, we TRIED TO GIVE THEM another thing, and failed miserably.
——
Look, I’m grateful you appeal to the hegemony, recognize the truth of the thing, and bend to its will, thats GREAT. That’s why you can I can hammer out an awesome America 3.0 future, that accepts the political realities for what they are, and keeps the hegemony sated.
BUT, that lesson above is that MP is not good at schizophrenically responding to the failure of the fiscal side to serve the hegemony it is elected to serve.
Hell, I’m a moral BitCoin loving Austrian who supports NGDPLT bc I’m a realist.
I’m stunned in light of 1970s’ to now, that you keep trying to bake your morals into MP. The lesson of Burns is the clear compromise of Friedman:
OK, let’s have a growing base, etc. BUT let’s the the human element out of this thing.
Maybe your hometown Main Street wasn’t boarded up and covered with graffiti like mine was. I remember every kid on my blue collar playground, singing, “My peanut has a first name, its J-I-M-M-Y”
You quixotic attempt to make stagflation the understandable least bad option WHILE arguing the Boomers were DUE IT…. why?
To what end? Why go down that path? When do we argue people aren’t getting the MP they deserve? How do you prove it? When they have jobs?
September 11th, 2013 at 4:49 pm PDT
link
“If you’ve read all of this, there is something terribly wrong with you.”
How did you know???
I agree with #3: Burns and the 1970s are ripe for some revisionism and a revaluation. I didn’t see a link to Ryan Avent at The Economist who quotes the original post:
http://www.economist.com/blogs/freeexchange/2013/09/generations
“Monetary contraction succeeded — third time’s the charm! — when the demographic onslaught was subsiding, when Reagan cowed the unions, when the country was at relative peace. It might not have been practical otherwise.”
What about Japan and Germany coming online? Japan was mentioned in the original post. Wage inflation took multiple hits with Volcker, Reagan breaking PATCO, globalization and trade policies (containerization), and possibly even the End of the Cold War. There is no alternative.
I would be surprised if we ever seen inflation like we had in the 70s again in the coming decades. Unions were able to lock in annual price increases in contracts back then but no longer. Instead we see asset bubbles and financial “innovations” which extend leverage and credit. Monetary policy is employed to pop these bubbles, not restrain wage inflation and keep the peace.
September 11th, 2013 at 4:56 pm PDT
link
“In the Orphanides paper that Karl Smith points to we find evidence that the Fed overestimated potential GDP during this time. Suppose instead we had “optimal” monetary policy with the unemployment rate kept near NROU instead of falling far below it as it did for nearly all of 1963-74. Then core inflation might not have risen from 1.2% in 1964-65 to 10.1% in 1974-75. Yes unemployment would have been 5.8% instead of 3.4% in 1969-70, and over 6% from 1971 on, but core inflation would have remained low.”
That’s the question though Mark. Why should we prefer an unemployment rate 80% higher just to get to say we kept core inflation down? I think this is at the heart of what Steve is getting at too. Burns and company arguably weren’t willing to make this sacrifice-driven likely be concern about social unrest and heightened economic pain. What I don’t get is why is there this belief in low inflation at any price? It seems to be yours as well.
September 12th, 2013 at 12:03 am PDT
link
Mike Sax,
“Why should we prefer an unemployment rate 80% higher just to get to say we kept core inflation down?”
Yes, 80% higher sounds very scary when you put it that way. But the fact is that 5.8% unemployment wasn’t that bad considering the demographics. That’s about what you would get if you age weighted the unemployment rate in a manner like George L. Perry:
http://www.brookings.edu/about/projects/bpea/editions/~/media/Projects/BPEA/1970%203/1970c_bpea_perry_schultze_solow_gordon.PDF
“Burns and company arguably weren’t willing to make this sacrifice-driven likely be concern about social unrest and heightened economic pain.”
What social unrest? There was far more social unrest when unemployment was 3.4% in 1968-69 than there was during the relatively peaceful Ford and Carter years when unemployment averaged 7.0%. And that wasn’t that high anyway considering NROU averaged 6.2% during that time.
“What I don’t get is why is there this belief in low inflation at any price? It seems to be yours as well.”
If you try to peg the unemployment rate below its natural rate you get accelerating inflation, so this is not about low inflation at all, it’s about non-accelerating inflation. In my opinion inflation as high as 4% is okay, but you will have the same problem with accelerating inflation at any level of inflation if you try to hold unemployment too low.
September 12th, 2013 at 12:47 am PDT
link
The social unrest in 68 was noneconomic it was about race, Vietnam, and cultural issues. However, if the public felt that the government was deliberately raising the unemployment rate just to keep inflation low there may have been some social unrest there as well.
Economic factors can cause unrest too. The late 60s were actually unusual as they weren’t economically based. In any case this is Burns but especially Nixon wanted to keep unemployment low. Nixon’s economic policy was all about politics. He believed there’d be a lot to pay for politically for both him and the Republican party if after having 3.4% unemployment it immediately went up to 6.0% after he got in.
http://www.amazon.com/Nixons-Economy-Booms-Busts-Dollars/dp/0700608885/ref=sr_1_1?s=books&ie=UTF8&qid=1378977770&sr=1-1&keywords=nixon%27s+economy
September 12th, 2013 at 5:23 am PDT
link
I would say Mark that any time unemployment suddenly goes up by a large amount it can at least potentially cause unrest and policymakers know this instinctively.
September 12th, 2013 at 5:25 am PDT
link
In any case, the real question is the choice in favor of low inflation-or as you put it ‘nonacelerating level of inflation’ at the expense of employment. During this crisis policymakers in the U.S. but even more so in Europe have been willing to suffer unemployment because they were rigidly adhering to an inflation goal.
Even Bernanke with a 1.1% inflation rate isn’t calling for more. It seems to me that Steve is right: it used to be that policymakers would accept higher inflation for lower unemployment but since the 80s its been the opposite. This doesn’t seem like an improvement and this focus is the legacy of the Monetarists-the original Ms obviously not the Market Monetarists who are a new phenomenon.
I mean it is possible to question the very idea of a ‘natural rate of unemployment.’
September 12th, 2013 at 5:31 am PDT
link
Bill Mitchell indeed does question the ‘natural rate of unemployment.’
http://bilbo.economicoutlook.net/blog/?p=22980
http://bilbo.economicoutlook.net/blog/?p=1502
After all this is Friedman’s legacy. Nairu wasn’t believed prior to him so it’s possible not to believe in it. Whatever the cause of the Great Inflation, I think you have to admit that it wasn’t the worst economy in the world-though it certainly was problematic. I mean would you trade the 70s for the post 2008 economy?
Whether you would or not people out of work would. Even Sumner himself has argued that if the Fed had responded as he thinks they should have back in 2008 we’d have ‘stagflation’ now instead-ie, the 70s.
http://www.themoneyillusion.com/?p=14924
There are worse things than inflation-you do acknowledge that 4% wouldn’t be so bad, indeed, I’d say it might be welcome now.
September 12th, 2013 at 5:38 am PDT
link
Mark, if you have time I would love for you to point out any errors in my Hyperinflation FAQ.
http://howfiatdies.blogspot.com/2012/10/faq-for-hyperinflation-skeptics.html
September 12th, 2013 at 7:06 am PDT
link
Mike Sax,
“However, if the public felt that the government was deliberately raising the unemployment rate just to keep inflation low there may have been some social unrest there as well.”
I can’t speak for what the public knows, or doesn’t know, but in my opinion the level of unemployment is always a policy choice even if you choose to do nothing about it.
Is there any evidence that social unrest is correlated to unemployment? Not especially. There’s evidence that very high rates of unemployment (e.g. 20% or 30%) may lead to statist political movements as it did in the Great Depression. But 6% was *not* a very high rate of unemployment especially when there were so many new entrants in to the labor force.
“In any case this is Burns but especially Nixon wanted to keep unemployment low. Nixon’s economic policy was all about politics. He believed there’d be a lot to pay for politically for both him and the Republican party if after having 3.4% unemployment it immediately went up to 6.0% after he got in.”
That reminds me of another good paper on Arthur Burns written by an old professor of mine. Thanks to Nixon’s pathological record keeping we know he pressured Burns into juicing the economy before the 1972 election:
How Richard Nixon Pressured Arthur
Burns: Evidence from the Nixon Tapes
Burton A. Abrams
Fall 2006
Introduction:
“Richard Nixon demanded and Arthur Burns supplied an expansionary monetary policy and a growing economy in the run-up to the 1972 election. Table 2 provides information on the growth rates for M1, M2, and real GDP for 1970 through 1972. M1 growth increased in each of the three years, starting at approximately 4.5 percent growth in 1970 and ending at slightly over 7.5 percent annualized growth over the first half of 1972. M2 growth expanded even faster. Real growth in the economy was accelerating, too. In 1972, real GDP grew 7.7 percent and certainly helped Nixon in the election.”
http://cba.unomaha.edu/faculty/mwohar/WEB/links/Donestic_Money_papers/Abrams_jep-v20n42006.pdf
But the fact that Nixon was willing to do almost anything to get relected in 1972 (recall a little scandal known as “Watergate”?) is not a compelling case for doing the things that he did.
“I would say Mark that any time unemployment suddenly goes up by a large amount it can at least potentially cause unrest and policymakers know this instinctively.”
I never suggested that unemployment should be raised suddenly. I suggested that unemployment could have been kept near NROU. If such a policy had been followed there would have been far *less* unemployment volatility in the 1960s and 1970s as it ranged all the way from 3.4% to 9.0%.
“Even Bernanke with a 1.1% inflation rate isn’t calling for more. It seems to me that Steve is right: it used to be that policymakers would accept higher inflation for lower unemployment but since the 80s its been the opposite. This doesn’t seem like an improvement and this focus is the legacy of the Monetarists-the original Ms obviously not the Market Monetarists who are a new phenomenon.”
When doing comparisons between the unemployment of the 1960s and 1970s and the 2000s and 2010s here’s the two graphs you need to keep side by side:
http://research.stlouisfed.org/fred2/graph/?graph_id=136939&category_id=0
http://research.stlouisfed.org/fred2/graph/?graph_id=136940&category_id=0
It’s like night and day. From 1963Q3 through 1979Q4, a period of 16.5 years, unemployment was *below* NROU nearly 80% of the time. From 2001Q4 to the present, a period of nearly 12 years, unemployment has been *above* NROU nearly 80% of the time.
The only thing these two periods have in common is people keep claiming there is some mystery about inflation. With respect to the 1960s and 1970s people wonder where the Great Inflation came from. With respect to the 2000s and 2010s people wonder why we don’t have deflation.
There’s a simple reason why we don’t have deflation and it has to do with the shape of the Phillips Curve:
http://www.bized.co.uk/sites/bized/files/images/virtual/bank/phillips.gif
It’s a curve! The Phillips Curve gets more elastic the high unemployment goes.
Remember all of the Hyperdeflations in history when prices spiraled downward by over 50% a month? Neither can I.
It just doesn’t happen. Because it’s a curve it’s very possible to have prolonged periods of high unemployment with positive rates of inflation.
“Bill Mitchell indeed does question the ‘natural rate of unemployment.’”
Bill Mitchell also thinks calling something a “crock” repeatedly is a persuasive argument. He has a few good points mixed in with the hyperbole there but nothing there that anyone who has thought about NROU isn’t aware of.
My biggest criticism is that there are good estimates of the natural rate of unemployment, and there are very bad ones, so be very careful. The European Commission estimates that Spain’s Non-Accelerating Wage Rate of Unemployment (NAWRU) is currently 23.7% and they are forecasting that it will rise to 25.9% next year. Spain does have huge problems with its insider/outsider labor market structure, but there’s no way that their NAWRU is approaaching 30%.
The European Commission uses a Kalman filter that basically is a trend estimate, so whatever the unemployment rate is that is the natural rate. (It’s what I like to call the “wherever you go, there you are” method.) Fortunately the CBO uses a much better method for estimating the NROU, and almost all of the competing estimates for the natural rate of unemployment in the US are higher than it. So I have a great deal of respect for the CBO’s NROU.
“After all this is Friedman’s legacy. Nairu wasn’t believed prior to him so it’s possible not to believe in it.”
During the 1960s (regardless of what Robert Waldmann may say) most Keynesian economists believed in the concept of a fixed relationship between unemployment and inflation, or a Phillips Curve. But this relationship seemed to break down starting in the late 1960s. (The term “stagflation” was coined by British politician Iain Macleod in 1965.) This gave rise to the “accelerationist hypothesis” by Monetarists Milton Friedman and Edmund Phelps, which essentially stated that any attempt to hold the unemployment rate below the “natural rate” would lead to accelerating inflation. They advocated a nonactivist approach to monetary policy believing that the unemployment rate would tend towards the natural rate without any intervention.
In my opinion the “accelerationist hypothesis” was one of Friedman’s greatest achievements. The following paper is in fact the very first reading assignment in my class on issues in monetary policy:
http://www.aeaweb.org/aer/top20/58.1.1-17.pdf
One of the main lessons of this paper is that monetary policy cannot peg the unemployment rate in the long run. (Say that 100 times before you go to bed every night and it will sink in.)
Franco Modigliani and Lucas Papademos coined the term Non-Inflationary Rate of Unemployment (NIRU) in 1975 which was later revised to Non-Accelerating Rate of Unemployment (NAIRU). While Friedman and Phelps believed that the existence of a natural rate implied that there was no useful trade-off between inflation and unemployment, Modigliani and Papademos interpreted the NAIRU as a constraint on the ability of policymakers to exploit a trade-off that remained both available and helpful in the short run. But despite the fundamental differences that still existed between the Monetarists and the Keynesians, the NAIRU was seen by many contemporary economists as helping build a consensus about the nature of the inflation-unemployment relationship.
Natural Selection was not a belief before Darwin and nobody believed the Theory of Relativity before Einstein. Of course it’s possible to not believe in those things but that fact that nobody believed those things before they thought of them is not a very compelling argument against those beliefs.
“Whatever the cause of the Great Inflation, I think you have to admit that it wasn’t the worst economy in the world-though it certainly was problematic. I mean would you trade the 70s for the post 2008 economy?”
I think that’s my whole point. The Great Inflation was not a bad time. From the perspective of labor market tightness, it was an extremely good time, in fact too good of a time. To borrow Hangover Theory from the Austrians, it would have been a whole lot better of a time if we tuned down the volume of the Soaring Sixties a little bit so we didn’t have to pay for it with an inflation hangover in the last half of the 1970s.
“Even Sumner himself has argued that if the Fed had responded as he thinks they should have back in 2008 we’d have ‘stagflation’ now instead-ie, the 70s.”
Sumner’s whole point is the 1970s were not stagnant so the “stagflation” of the 1970s is a myth. Sumner wants some catch up NGDP, and then a steady rate of 5% NGDP growth afterwards. He is not calling for a 10.4% average NGDP growth rate like we had in the 1970s.
September 12th, 2013 at 12:27 pm PDT
link
Vincent Cate,
I decided to leave my response here just so I could air my views a little more publicly.
Your Hyperinflation FAQ startes out with a lot of widely accepted and commonsense statements. But it quickly veers into an over the top hyperinflation fearfest that I simply do not subscribe to.
My two biggest issues are the following:
1) You say:
“How is hyperinflation defined?
The International Accounting Standard of IAS 29 says there is hyperinflation when “the cumulative inflation rate over three years approaches, or exceeds, 100%.”. This works out to 26% per year. There are many other definitions for hyperinflation but they almost all have something like “inflation over X per year” or “inflation over Y per month”…”
Here is what the IAS says:
“The Standard does not establish an absolute rate at which hyperinflation is deemed to arise – but allows judgement as to when restatement of financial statements becomes necessary. Characteristics of the economic environment of a country which indicate the existence of hyperinflation include: [IAS 29.3]
the general population prefers to keep its wealth in non-monetary assets or in a relatively stable foreign currency. Amounts of local currency held are immediately invested to maintain purchasing power;
the general population regards monetary amounts not in terms of the local currency but in terms of a relatively stable foreign currency. Prices may be quoted in that currency;
sales and purchases on credit take place at prices that compensate for the expected loss of purchasing power during the credit period, even if the period is short;
interest rates, wages, and prices are linked to a price index;
and the cumulative inflation rate over three years approaches, or exceeds, 100%.”
http://www.iasplus.com/en/standards/ias/ias29
So a 100% increase in prices over three years is *not* an absolute cutoff, and in fact it’s *only one of five conditions* that need to be met.
More importantly you invoke one fifth of the IAS definition with almost no discussion of Phillip Cagan’s definition of hyperinflation. Here’s what Steve Hanke has to say about the definition of hyperinflation:
“The literature on hyperinflation is riddled with a variety of definitions, and more often than not, they are vague and ill-defined. In search of a cornerstone for our definition of hyperinflation, we began with Philip Cagan’s (1956) widely accepted definition: a price-level increase of at least 50% per month.
Under Cagan’s definition, an episode of hyperinflation starts when there is a month in which the price level increases by at least 50%. When the monthly inflation rate drops below 50% and stays there for at least one year, the episode is said to end.”
http://www.cato.org/sites/cato.org/files/pubs/pdf/WorkingPaper-8.pdf
Phillip Cagan’s definition is the most widely accepted definition of hyperinflation bar none, and there’s a world of difference between 100% inflation over three years and 50% inflation in one month.
2) You say:
“Deflation often comes before hyperinflation. Deflation should really be viewed as a precursor to hyperinflation and not a blocker of hyperinflation.”
And you link to the following:
http://www.marketskeptics.com/2008/12/how-deflation-creates-hyperinflation.html
Which points out that Weimar Germany suffered a very brief spell of deflation in 1920-21. However, to my knowledge, out of 56 cases of hyperinflation listed by Steve Hanke this is the *only* case that involved deflation shortly before hyperinflation started.
To see how inflation has to precede hyperinflation let’s take a look at Weimar Germany more closely. The German wholesale price index can be found on Table V, page 442:
http://mises.org/books/economicsofinflation.pdf
World War I started in July 1914. By August prices started rising. Inflation reached double digit levels almost immediately with annual inflation in 1915 being 34.7%. But thereafter prices rose more slowly averaging 19.8% a year over the four years through 1918.
With war’s end inflation took off reaching 92.2% in 1919, 257.4% in 1920, falling to 28.8% in 1921, then rising to 1685.6% in 1922 and going into sustained hyperinflation (50% a month) in May 1923. (Note that in terms of wholesale prices there is no evidence of hyperinflation in 1920.)
So from the time that Germany suffered a rate of inflation faster than at anytime in American history, it took 8 years involving defeat in a devastating war before sustained hyperinflation set in.
Now, there are cases of hyperinflation setting in almost immediately following the demise of a currency area, such as the end of Yugoslavia and the Soviet Union in the early 1990s. But in every case involving a country with its own currency from the beginning, hyperinflation was preceded by years, sometimes decades, of double digit inflation.
For example China had suffered double digit inflation since 1937 when it went into hyperinflation in 1947. Brazil had consistently experienced double digit inflation since 1967 when it went into hyperinflation in 1989. Zimbabwe had been in double digit inflation since 1989 when it went into hyperinflation in 2007.
September 12th, 2013 at 2:04 pm PDT
link
Hi Mark. Thanks for all the feedback. Whether you’re right or not I always appreciate your powers of analysis an to justify claims you make in a rigorous way. While I have nothing against Sumner-and actually do admire him in a number of ways, though he’s clearly not a big fan of mine-he’s not always so great about answering questions he’s not so impressed with in a thorough way-I guess you might call his tendency in such situations is to be rather ‘terse’ not to say ‘abrupt’ or ‘snarky.’ Certainly you do some great work for the Market Monetarist cause then.
“I can’t speak for what the public knows, or doesn’t know, but in my opinion the level of unemployment is always a policy choice even if you choose to do nothing about it.”
This just shows what’s a different approach between you and I. My reasoning in making this claim is intuitive-logically people are not going to be happy with rising unemployment-or underemployment a topic which I think that is given far too short a thrift-and if they actually hear that treahe government in some sense is ‘deliberately’ raising the unemployment rate just to keep the inflation low that could lead to real social frustration.
So I didn’t really take it as something that needed to be proved. If you can pore over a bunch of stats that show there is no correlation I would still be rather slow to buy it-just because it’s simple logic.
If you want historical examples obviously the 30s is a great example in the movements that got started in places like Germany and Italy. For a more recent example. see all the social protests in Britain and the Continent. Even in the U.S. we had some with the rise of the Occupy Wall Street movement.
More than just what the people think-and few understand monetary policy and so are more rather than less likely to be outaged to hear that higher unemployment is actually the goal of the Central Bank-I was talking about what policymakers-in electoral politics not so much the monetary authorities-who judging by their actions certainly think that higher unemployment at least makes social unrest more likely.
September 12th, 2013 at 3:46 pm PDT
link
“My biggest criticism is that there are good estimates of the natural rate of unemployment, and there are very bad ones, so be very careful. The European Commission estimates that Spain’s Non-Accelerating Wage Rate of Unemployment (NAWRU) is currently 23.7% and they are forecasting that it will rise to 25.9% next year. Spain does have huge problems with its insider/outsider labor market structure, but there’s no way that their NAWRU is approaaching 30%.”
I’m glad to hear there are good ones. The one you describe in Spain is exactly why I have issues with Nairu-it is being used there at least to justify appalling rates of unemployment. What does the CBO current NAIRU rate say it is? If it says it’s 7.4% I’m not impressed.
September 12th, 2013 at 4:23 pm PDT
link
“It’s like night and day. From 1963Q3 through 1979Q4, a period of 16.5 years, unemployment was *below* NROU nearly 80% of the time. From 2001Q4 to the present, a period of nearly 12 years, unemployment has been *above* NROU nearly 80% of the time.”
What may be going on is what Steve talked about-policymakers, by which I mean especially Central Bankers-cared more about low unemployment then and low inflation now. The reason they care about low inflation so much now is I think a legacy of an idea like NAIRU that says lets not let aim for Full Employment-ergo, we don’t have to have the fiscal stimulus that Friedman was so opposed to.
I’d say that the conservatism of CBers today stems back to the turn towards the CB as an inflation fighter first and foremost.
September 12th, 2013 at 4:27 pm PDT
link
Mike Sax,
“For a more recent example. see all the social protests in Britain and the Continent. Even in the U.S. we had some with the rise of the Occupy Wall Street movement.”
Employment is at record levels in the UK and the US is doing relatively well compared to Europe. And in any case, Occupy Wall Street didn’t start until three years after Lehmans, and where is it now?
Where are the protests where the economies have truly cratered, such as Greece, Portugal or Spain? Yes there’s been some, but nowhere near what your theory predicts. Spain is in its fourth year of 20% plus unemployment. People there are far too busy scratching out daily survival to hold the authorities responsible. Protest is a luxury for well-to-do college kids with plenty of free time on their hands. That’s why it occurs far more when times are prosperous than when times are hard.
“What does the CBO current NAIRU rate say it is? If it says it’s 7.4% I’m not impressed.”
Don’t you read or look at the things I post? NROU is currently 5.5%. For comparison the OECD estimates that NAIRU is 6.1% in the U.S.
“The reason they care about low inflation so much now is I think a legacy of an idea like NAIRU that says lets not let aim for Full Employment-ergo, we don’t have to have the fiscal stimulus that Friedman was so opposed to.”
I strongly disagree. Properly estimated, NAIRU *is* the full employment unemployment rate. This is the fifth year the unemployment rate will be above NROU in the U.S., and at the rate that unemployment is falling, it will be at least three more years before the unemployment rate hits NROU. So that’s eight consecutive years of unemployment above NROU. That’s a very long time to be overshooting something that you’re supposedly targeting.
This isn’t the legacy of NAIRU, it’s the legacy of Inflation Targeting (IT). IT says the sole purpose of monetary policy is to keep inflation low and stable no matter what:
http://www.youtube.com/watch?v=ErFsW4-FDWw
It’s no surprise to me that the most accurate part of the FOMC’s forecasts have been their core inflation projections which have been consistently within a hair’s breadth of perfection. If you’re not forecasting your target you’re forecasting failure.
Friedman was opposed to fiscal stimulus because it cannot make up for bad monetary policy. Look at Japan. Even cyclically adjusted budget balances show Japan has been running enourmous fiscal deficits for 20 years now, and yet NGDP is lower than when they started.
September 12th, 2013 at 5:46 pm PDT
link
“This is the fifth year the unemployment rate will be above NROU in the U.S.,…”
Did I say fifth? I should have said sixth, which means we’re headed for nearly ten consecutive years of unemployment above NROU. This isn’t anything like the 1960s or 1970s.
September 12th, 2013 at 5:49 pm PDT
link
Mark you said:
“Employment is at record levels in the UK and the US is doing relatively well compared to Europe. And in any case, Occupy Wall Street didn’t start until three years after Lehmans, and where is it now?”
So what do you think motivated OWS then? Lehman may have sunk in 2008 but the pain was still being felt in 2011.
I see that you have bought totally into this Sumner narrative about ‘record employment” in Britain. When did 7.8% become a record? Just because it’s been even worse in Europe doesn’t mean it hasn’t been tough in the U.S. True in the land of the blind the one-eyed man is King. Yet he still has trouble seeing. If I have diabetes and you have cancer this doesn’t make my diabetes less painful because you have something worse.
“Where are the protests where the economies have truly cratered, such as Greece, Portugal or Spain? Yes there’s been some, but nowhere near what your theory predicts. Spain is in its fourth year of 20% plus unemployment. People there are far too busy scratching out daily survival to hold the authorities responsible. Protest is a luxury for well-to-do college kids with plenty of free time on their hands. That’s why it occurs far more when times are prosperous than when times are hard.”
My theory-if you want to call it that, to me its just common sense which I guess economics sometimes tends to discover, at least the Neoclassical variety-doesn’t predict any particular level of protests. There have been plenty of protests in Spain and Greece. Just how many does my theory ‘predict’-give me a number. I certainly never offered any. Of course, every situation is different. You’re saw about protests being just for rich, college kids is a little glib as well. Do you think the Arab Spring is just about rich college kids?
How about the U.S. Revolution? I say my theory such as it is, is obvious. Politicians seem to understand this insticntively-if the economy is bad people will likely want a change. Now if they see no hope of change through the normal electoral channells they will see other more unpleasant channells. It seems to me that uprisings and revolutions have more than one cause. Sometimes its economic. sometimes its other factors-political oppression.
While we’re at it I disagree with you and the other Monetarists, et. al that hyperinflation is a monetary phenmoenon. It’s actually caused by political instability.
September 12th, 2013 at 11:26 pm PDT
link
As you like to tease out correlations, I want you to name me one example of a hyerinflation that didn’t at least correlate with political instability-sure hope you don’t plan on saying Weimar as it’s tough to find in history a more unstable regime than that one.
September 12th, 2013 at 11:29 pm PDT
link
Mike Sax,
“I see that you have bought totally into this Sumner narrative about ‘record employment” in Britain. When did 7.8% become a record?”
Employment in UK reached a peak in April 2008 prior to the recession. It has exceeded that peak since July 2012:
http://research.stlouisfed.org/fred2/graph/?graph_id=120770&category_id=0
Yes unemployment is still high but that’s because the labor force participation rate has increased to record levels. The UK is the only one of the four large advanced currency areas at or near the zero lower bound in which employment is at record levels.
“Do you think the Arab Spring is just about rich college kids?”
The activists most responsible for rallying the public to the streets were young, college educated tech-savvy individuals adept in the use of social media, who often had prior exposure to living and working abroad. (I have colleagues in Jordan and Morocco.)
“While we’re at it I disagree with you and the other Monetarists, et. al that hyperinflation is a monetary phenmoenon. It’s actually caused by political instability.”
Hyperinflation is caused by a combination of a collapse in money demand and a rapid acceleration of money supply. And regardless of what is the initial spur, every hyperinflation in history involved a massive expansion of the monetary base.
Hyperinflation does not happen suddenly and without warning. Typically it is preceded by at least several years, and sometimes decades, of sustained double digit inflation. Regardless of why policymakers choose to permit high rates of inflation the *proximate cause* is always monetary policy.
September 13th, 2013 at 12:26 am PDT
link
On hyperinflation I’m not convinced. Each example you can look at-Germany, Zimbabwee et. al has had political instability. This is a pretty impressive correlation. I don’t think you can show me an example of a country that has had hyperinflation that hasn’t had deep PI.
What caused Germany was the crushing debt of WWI along with the political problems of the Weimbar Republic. When a government’s very survivial is on the line one of the effects is that trust in the currency plummets
Some other examples:
“The world’s first recorded hyperinflation came during the French Revolution, where monthly inflation peaked at 143 percent, but it took until the 20th century for this type of out-of-control inflation to happen again.”
http://www.cnbc.com/id/41532451
Hmm. Did this happen because the French monetary authorities wanted to overstimulate the economy or because of massive instability-the bloody revolution and overthrow of the Old Regime-monarchy, clergy, and gentry?
“The report outlines that during the 20th century, seventeen hyperinflations occurred in Eastern Europe and Central Asia, including 5 in Latin America, 4 in Western Europe, 1 in Southeast Asia and one in Africa. The United States has never been a victim of hyperinflation but came close twice – during the Revolutionary War and Civil War – when the government printed currency in order to pay for its war efforts. However, in both of the US cases, inflation never exceeded a 50 percent monthly inflation rate (an informal threshold for hyperinflation), which pales in comparison to history’s most dramatic cases.”
In all these examples, you had political instability. Not one on the list that didn’t have PI.
September 13th, 2013 at 5:58 am PDT
link
“Employment in UK reached a peak in April 2008 prior to the recession. It has exceeded that peak since July 2012”
Well, this is still not a record in unemployment. In Japan they’ve had a much lower unemployment rate during the entire period of what is called the Great Stagnation. By this measure their policies-which you and Sumner claim was massive fiscal stimulus-were a huge success.
I just don’t see what Britian having 7.8% proves-he thinks it proves that austerity is awesome as they did it and their unemployment is not as high as other countries. Yet by this criteria we have to declare Japan a success with unemployment under 5 and even under 4.
September 13th, 2013 at 6:08 am PDT
link
I’ve made a similar argument at different sites around the econosphere, originally heard it from Chuck Clough, the ex-Merrill Lynch strategist.
http://www.elitetrader.com/vb/printthread.php?threadid=247493
“Deflation/inflation is a demographic and real phenomenon, not a monetary phenomenon. Inflation is caused by too many young people forming households, not saving, and chasing too few goods. That was the 1970s in the US and the 1960s in Japan. Old people don’t cause inflation because the aged and infirm never spend money. Again, see Japan.”
September 13th, 2013 at 8:44 am PDT
link
Mike Sax,
1) Hyperinflation
Political instability is not cause of hyperinflation anymore than umbrellas are the cause of rain.
In every single case of hyperinflation there were years sometimes decades of double digit inflation preceding the hyperinflation. So the problem with inflation almost always preceded the political instability and inflation itself was almost certainly a causal factor in the political instability.
And as you probably realize from reading Sumner’s blog from now monetary policy is as much about money demand as it is about money supply. An accelerating rate of inflation caused by an excessive supply of money increases the “shoe leather” cost of using the currency and increases the cost of holding it for any length of time. This provides an incentive to hold less of the currency for any length of time and find substitutes wherever possible. So there is a feedback loop from excess supply of money to decreased demand for money.
In fact if we use the velocity of money (i.e. GDP divided by money supply) as a proxy for the inverse of money demand we note there is a very strong and significant orrelation between the inverse of money demand and inflation:
http://research.stlouisfed.org/fred2/graph/?graph_id=137129&category_id=0
So all inflations involve both an increasing supply of money and decreasing money demand. Hyperinflation just pushes inflation to its highly unstable conclusion where the quantity supplied rises to infinity and quantity demand drops to zero. And in cases where hyperinflation has led to “dollarization”, the inflation occurs only in terms of the local currency, not the foreign currency, so this suggests that the hyperinflation does not have a life of its own but is in fact related to the particular unit of account.
In short, causality matters.
2) The effectiveness of demand side policies and the UK versus Japan
The big four advanced currency areas that are currently at or near the zero lower bound in policy interest rates are the U.S., the eurozone, Japan and the U.K.
One proxy for the amount of QE done is monetary base expansion. This isn’t perfect of course since it also measures other policy responses such as “credit easing”. The ECB has done credit easing but no QE for example. But let’s not make things too complicated for the moment.
As of May the BOE’s monetary base was up by 348% since August 2008, the Federal Reserve’s up by 260%, the BOJ’s up by 75% and the ECB’s up by 48%:
http://thefaintofheart.files.wordpress.com/2013/06/sadowski3_1.png
Since aggregate demand (AD) is the appropriate measure of the effectiveness of macroeconomic policies whose ultimate purpose is in fact to stimulate AD, perhaps we should look at the relative AD performance of the four large advanced currency areas since the Great Recession. But before we do that, we should take a look at the other main policy tool for stimulating AD, namely fiscal policy.
In my opinion the most objective way of measuring fiscal policy stance is the change in the general government cyclically adjusted balance, particularly the cyclically adjusted primary balance (CAPB). The cyclically adjusted balance takes into account any changes in the general government budget balance due to the business cycle. Thus changes in the cyclically adjusted balance are mostly due to discretionary fiscal policy, and consequently may be taken as a proxy for the degree of fiscal stimulus. The CAPB goes a step further, factoring out changes in net interest on government debt and thus ensuring that practically all of the changes in fiscal balance are discretionary in nature. The following is a graph of the changes in CAPB by currency area over the calendar years 2009-13. All data comes from the April 2013 IMF Fiscal Monitor.
http://thefaintofheart.files.wordpress.com/2013/06/sadowski3_10.png
The first thing you should note is that Japan has had the most expansionary fiscal policy every year without exception. And although all of the currency zones adopted a much less expansionary fiscal policy stance in 2010, it was the U.K. that took the lead in fiscal consolidation, having the most contractionary fiscal policy in both 2010 and 2011. The U.S. has had the most contractionary fiscal policy starting with calendar year 2012.
Now, let’s take a look at relative AD performance. To be technical, AD is nominal GDP (NGDP) when inventory levels are static (i.e. nominal Final Sales of Domestic Product). Thus for all intents and purposes AD is virtually identical to NGDP. The following is a graph of the NGDP of the four big advanced currency areas with NGDP indexed to 100 in 2008Q2, that is, before large scale monetary base expansion started in September 2008.
https://research.stlouisfed.org/fred2/graph/?graph_id=125131&category_id=0
Note that the U.K. led in relative NGDP growth from 2010Q1 through 2011Q3 with the exception of 2010Q4 and 2011Q2. The U.K. also led in relative monetary base growth from June 2009 through January 2011. And as previously noted the U.K. had the most contractionary fiscal policy in 2010 and 2011.
The U.S. has led in relative NGDP growth since 2011Q4. The U.S. also led in relative monetary base growth from February 2011 through January 2012. And as previously noted the U.S. has had the most contractionary fiscal policy starting with calendar year 2012.
Japan has ranked last in relative NGDP growth throughout. Japan has also ranked last in relative monetary base growth with the exception of March through August 2011 and since April 2013. And as previously noted Japan has had the most expansionary fiscal policy throughout.
3) Comparing international unemployment rates.
One needs to be careful when comparing the unemployment rates across countries. You need to take into account the Okun’s Law coefficient, or the percentage points that GDP falls for every one point increase in the unemployment rate, as well as the natural rate of unemployment in the individual countries.
For Okun’s Law coefficients I would refer to Laurence Ball’s recent and definitive paper on the subject:
http://www.imf.org/external/pubs/ft/wp/2013/wp1310.pdf
In Table 5 you can find the estimated betas. Taking the inverse gives you the Okun’s Law coefficient. For the US, Japan and the UK the Okun’s Law coefficient is about 2.3, 6.6 and 2.9 respectively. Why is Japan’s so high? The most likely is Japan’s tradition of “lifetime employment” which makes firms reluctant to layoff workers. Thus changes in output are reflected more in hours worked per employee or in worker productivity than in changes in the unemployment rate.
For international estimates of NAIRU the most authoritative source is probably the OECD:
http://stats.oecd.org/Index.aspx?QueryId=48230
NAIRU is 6.1%, 4.3% and 6.9% in the US, Japan and the UK respectively. Last year the unemployment rate averaged 8.1%, 4.3% and 7.9% in the US, Japan and the UK respectively. If you compute the unemployment gap and multiply it by the Okun’s Law coefficient you get a rough estimate of the output gap. Doing this yields 4.6%, 0.0% and 2.9% of potential GDP for the US, Japan and the UK respectively.
By this measure Japan has no output gap, and this legitimately raises the question of why is Japan doing Abenomics at all? Aggregate demand stimulus is unlikely to raise real GDP (RGDP) or lower unemployment much. Most likely it will go into inflation. There might be other reasons for raising Japan’s NGDP such as reducing the ratio of public debt to NGDP, but this is just pure speculation on my part.
And the UK’s output gap, although larger than Japan’s, is still significantly smaller than the US’s and likely much smaller than the eurozone’s. But nevertheless aggregate demand stimulus would still be useful in raising RGDP and lowering unemployment there.
September 13th, 2013 at 11:33 am PDT
link
billyjoerob,
“Deflation/inflation is a demographic and real phenomenon, not a monetary phenomenon. Inflation is caused by too many young people forming households, not saving, and chasing too few goods. That was the 1970s in the US and the 1960s in Japan. Old people don’t cause inflation because the aged and infirm never spend money. Again, see Japan.”
The populations of Belarus, Hungary and Russia have been in steady decline since at least 1993 and all three have rapidly aging populations. And yet inflation was nearly 60% in Belarus, 6% in Hungary, over 5% in Russia last year:
http://www.imf.org/external/pubs/ft/weo/2013/01/weodata/weorept.aspx?sy=1993&ey=2012&scsm=1&ssd=1&sort=country&ds=.&br=1&c=913%2C922%2C944&s=PCPIPCH%2CLP&grp=0&a=&pr.x=61&pr.y=14
September 13th, 2013 at 11:52 am PDT
link
Thanks both Mark and Mike for your comments.
Governments at risk of hyperinflation are always spending far more than they get in taxes. Japan is spending about twice what they get in taxes. The way I like to look at it is that half the Japanese governments spending power comes from an ability to collect regular taxes and half comes from an ability to collect an inflation tax. This inflation tax is the ability to print money, or at a finer level of detail the ability to get the central bank under their control to buy their bonds. If for some reason they could not get the inflation tax they would have half the spending power. Even working toward this situation where the government can only buy half the supporters it used to, you should expect political instability. The government always goes down as the currency fails. But you need to see the deeper cause to these events, not just stop at “political instability”.
September 13th, 2013 at 1:22 pm PDT
link
Vincent I’m not sure why you consider political instability as an explanation for hyperinflation as insufficencetly deep. As opposed to ascribing it and everything else to monetary causes? Saying it’s all because the CB failed to hold the money supply or NGDP stable?
Mark: “In every single case of hyperinflation there were years sometimes decades of double digit inflation preceding the hyperinflation. So the problem with inflation almost always preceded the political instability and inflation itself was almost certainly a causal factor in the political instability.”
This is when I think Monetaris ts-of any stripe including Market Monetarists-go over board. So you are claiming that the hyperinflation during the Revolutionary period in France was caused by a steadily increasing inflation that had been increasing for 30 years or so and finally developed into hyperinflation and that the Revoution-along with the subsequent Great Terror were unimportant? Merely an epiphenomenon?
Is there evidence of this slowly rising inflation in the 30 years before the French R? Ditto in the 30 years or so in Germany prior to the Weimar Republic-where WWI and the subsequent huge war debt imposed on Germany is just an epiphenomenon?
September 13th, 2013 at 5:26 pm PDT
link
Mark thanks for your responses. While I certainly have many questions about Market Monetarism you certainly are its best asset. As Sumner says-on some things at least-you do a more able expositor than him. A slightly different question.
A reader at my blog, Diary of a Republican Hater, wonders if you ever read my blog. I told him I don’t know.
“Mike!!! Wow, thanks for the feature article… very very kind of you!!, but now the pressure really is on. Here I was gladly hiding in the shadows… and suddenly you’re amplifying my careless taunting of Sadowski! I HOPE he doesn’t notice, care, or take you seriously… I’m in no mood to cross out my entire blog just yet! :(”
http://diaryofarepublicanhater.blogspot.com/2013/09/for-those-who-seek-understanding-on.html
Let me put the question to you-have you? I know that both Marcus Nunes and Nick Rowe read it regularly. Whether you have or not I just wrote a new post about another conundrum-Sumner on both the subject of the price level and stagflation. I think he may have made bad bad gaffes on both-I’m virtually certain he did on stagflation.
If you are willing I’d be very happy if you contribute to this discussion and tell me whether he did slip here or whether I’m missing something.
http://diaryofarepublicanhater.blogspot.com/2013/09/strange-things-scott-sumner-has-said.html
September 13th, 2013 at 5:58 pm PDT
link
“And in cases wherean hyperinflation has led to “dollarization”, the inflation occurs only in terms of the local currency, not the foreign currency, so this suggests that the hyperinflation does not have a life of its own but is in fact related to the particular unit of account.”
Of course not. When the a banana republic falls apart and its currency becomes worthless it isn’t because anyone questions the stability of the U.S. government.
September 13th, 2013 at 6:04 pm PDT
link
Only the banana republic
September 13th, 2013 at 6:04 pm PDT
link
Incidentallly Mark I have a decent amount of readers-and Steve himself has kindly linked a post by me on this page.
September 13th, 2013 at 6:08 pm PDT
link
Mike, if the inflation was due to demographics and young people buying houses, then why does it not show up when measured in dollars but only in the local currency?
September 13th, 2013 at 7:15 pm PDT
link
Vince, understand that the argument was made by Steve not me. He’s probably the better person to defend it.
he e
I was talking about hyperinflation which I maintain is due to political instability-and while Mark is very good at providing numbers and graphs he has avoided dealing with the point I’ve made directly here: hyperinflation always correlates with political instability-there is no exeception. Now we’re not at causation yet but we’re batting 1000 on correlation which at least deserves notice.
My explanation for hyperinflation doesn’t require the U.S. dollar to tank when some banana republic totters and is overthrown destroying its currency. The U.S. government is one of the most stable governments in the world, why would anyone worry about it’s health?
September 13th, 2013 at 7:23 pm PDT
link
Mark your point regarding causality mattering is well taken and not possible to argue with. However, in the case if hyperinlfation we have a very simply causality: from the Cause-political instability- to one of it’s Effects- hyperinflation. When a political regime is in trouble trust in the currency goes the same way. Very simple C and E.
September 13th, 2013 at 7:46 pm PDT
link
Mike Sax,
“Is there evidence of this slowly rising inflation in the 30 years before the French R? Ditto in the 30 years or so in Germany prior to the Weimar Republic-where WWI and the subsequent huge war debt imposed on Germany is just an epiphenomenon?”
I never said “30 years”, I said years, and often decades.
“Assignats” were paper money issued by the National Assembly in France from 1789 to 1796, during the French Revolution. Such large amounts were issued that prices rose by 15.8% from January 1791 through January 1792 (this is the earliest records we have). On an annual basis prices were 17.3% higher in 1792 than in 1791:
http://www.persee.fr/web/revues/home/prescript/article/hism_0982-1783_1991_num_6_3_1396
Hyperinflation didn’t set in until May 1795, three years later.
The WW I era German wholesale price index can be found on Table V, page 442:
http://mises.org/books/economicsofinflation.pdf
World War I started in July 1914. By August prices started rising. Inflation reached double digit levels almost immediately with annual inflation in 1915 being 34.7%. Hyperinflation didn’t set in until May 1923, eight years later.
“Let me put the question to you-have you?”
I was reading it only today. I don’t read it regularly, I sometimes read it when I bump into you in the comment cages.
“If you are willing I’d be very happy if you contribute to this discussion and tell me whether he did slip here or whether I’m missing something.”
Mike:
“Well, there’s no question that on the subject of stagflation Sumner is wrong in his usage. On the price level of Japan question, it all comes down to this: is the exchange rate and the price level the same thing? If so Sumner is right. If not he made-another, along with stagflation-mistake.”
Sumner is evidently referring to the nominal exchange rate which is correct from a simple unit of account perspective (e.g. the Korean won is about 1000 to the dollar). Personally I think he should have spent more time clearly explaining what he meant by “price level”.
As for the meaning of the word “stagflation” I appeal to the history of its origin. On November 17, 1965, Iain Macleod, the spokesman on economic issues for the Conservative Party, warned of the UK’s economic situation in the House of Commons by saying “We now have the worst of both worlds—not just inflation on the one side or stagnation on the other, but both of them together. We have a sort of “stagflation” situation. And history, in modern terms, is indeed being made.”
At that time the unemployment rate in the UK was only 1.4%, so it’s obvious he wasn’t talking about the unemployment rate:
http://research.stlouisfed.org/fred2/data/LMUNRRTTGBM156S.txt
Moreover, the word “stagnation” refers to a state of inactivity, and in an economic context it carries the connotation of slow growth.
When the word came to be applied to the US it may have acquired the additional meaning of relatively high unemployment. But that was not how the word was originally used by Iain Macleod in 1965.
So I guess I’m calling both of these for Scott Sumner (big surprise).
September 13th, 2013 at 8:03 pm PDT
link
Mark, I have reworked the first section with the definition of hyperinflation. Please let me know what you think now:
http://howfiatdies.blogspot.com/2012/10/faq-for-hyperinflation-skeptics.html
September 13th, 2013 at 8:22 pm PDT
link
Actually while you calling it for Sumner was expected it’s pretty qualified. You acknolwedge that his use of ‘price level’ there was confusing. Maybe it’s because of his feeling that what matters is the MOA and not so much the MOE.
I agree with you that that Taylor Rule regime was totally fixated on inflation fighting to the detriment of all else. My difference is that I suspect Friedman with his NAIRU of contributing to it.
“In my opinion the “accelerationist hypothesis” was one of Friedman’s greatest achievements. The following paper is in fact the very first reading assignment in my class on issues in monetary policy:”
Where did you go to school Mark? Whatever I do now about Econ and monetary matters is self-taught-I would certainly give Sumner a good deal of credit for whatever knowledge I do have regardless of my differences with him.
It’s not surpising based on your impressive work that you had some formal training-where did you go?
September 13th, 2013 at 8:31 pm PDT
link
“As for the meaning of the word “stagflation” I appeal to the history of its origin. On November 17, 1965, Iain Macleod, the spokesman on economic issues for the Conservative Party, warned of the UK’s economic situation in the House of Commons by saying “We now have the worst of both worlds—not just inflation on the one side or stagnation on the other, but both of them together. We have a sort of “stagflation” situation. And history, in modern terms, is indeed being made.”
The whole point about stagflation is that it’s occurence in the 70s through cold water on the crude version of the Phillip’s Curve-the more ore less 1 to 1 tradeoff between inflation and unemployment.
If stagflation were not defined as having both high inflation and unemployment at the same time it wouldn’t have been such mud in the eye for the crude PC-Phillips himself as I’m sure you knew never thought it was actually that simple.
In any case, if stagflation were defined the Sumner way-high inflation and low GDP-the 70s wouldn’t be stagflationary as GDP didn’t do so bad in the 70s. As you say they weren’t such bad times.
September 13th, 2013 at 8:37 pm PDT
link
Vincent Cate,
Now that it explicitly mentions Phillip Cagan’s definition of hyperinflation it’s much better.
But the IAS clearly states:
“The Standard does not establish an absolute rate at which hyperinflation is deemed to arise…”
And yet you continue to imply that they establish an absolute rate when they mention the 100% inflation over three years criteria. That’s only one of the five conditions that the IAS says needs to be met.
So in my opinion it is still very deceptive the way it is written.
September 13th, 2013 at 8:43 pm PDT
link
Mark, another point. Yes, I only include part of the IAS definition. I believe however that all the other parts always come along with the part I have included. It is also the only part that has a quantified definition. Almost all the other definitions just have some number as the cutoff, so this is the part that is like other definitions. I really think it is arbitrary where exactly you draw the line.
September 13th, 2013 at 8:47 pm PDT
link
Mark, that last was without reading your latest. I agree. Will try again.
September 13th, 2013 at 8:49 pm PDT
link
“One of the main lessons of this paper is that monetary policy cannot peg the unemployment rate in the long run. (Say that 100 times before you go to bed every night and it will sink in.)”
Mark I admit I’m a bit of a cynic. Is it that the MP cannot do anything about U in the LR or simply that Friedman didn’t want it to do anything in the LR? That’s the way my mind works.
For me it all ends up as Republican policies that tells the poor, the unemployed, and the struggling middle are SOL-‘Sorry Out of Luck. Milton Freidman-and Bob Lucas, et. al- proved that we can’t help you.”
September 13th, 2013 at 8:58 pm PDT
link
Mike Sax,
“I agree with you that that Taylor Rule regime was totally fixated on inflation fighting to the detriment of all else.”
Except that the Taylor Rule also places weight on the unemployment gap or output gap. So in my opinion it’s actually better than Inflation Targeting (IT).
“It’s not surpising based on your impressive work that you had some formal training-where did you go?”
First of all when I said “my class” I meant the one I teach, although I haven’t taught that particular class in nearly three years.
I attended the University of Chicago for three years as an undergraduate. I completed 35 graduate hours in math at the University of Delaware. My degrees (BA math, BA math ed, BS math, MA economics) were all completed at the University of Delaware. I’m currently all but dissertation PhD in economics at the University of Delaware.
“The whole point about stagflation is that it’s occurence in the 70s through cold water on the crude version of the Phillip’s Curve-the more ore less 1 to 1 tradeoff between inflation and unemployment.”
Sort of, but not really. This is conflating two different although somewhaat related things. Stagflation referred to slow growth combined with inflation and originally had nothing to do with the later breakdown in the stable Phillips Curve relationship.
September 13th, 2013 at 9:09 pm PDT
link
Mark, I think I am getting close to reasonable on the definition of hyperinflation:
http://howfiatdies.blogspot.com/2012/10/faq-for-hyperinflation-skeptics.html
September 13th, 2013 at 9:18 pm PDT
link
Mike Sax,
“Is it that the MP cannot do anything about U in the LR or simply that Friedman didn’t want it to do anything in the LR?”
Monetary policy cannot peg the unemployment rate below the natural rate in the long run. (100 times, everynight.)
“Milton Freidman-and Bob Lucas, et. al- proved that we can’t help you.”
This is probably far more true about Bob “the unemployed are merely displaying a preference for leisure” Lucas than it is of Milton Friedman. I really have a hard time believing that Friedman wouldn’t be one of Scott Sumner’s biggest fans were he still alive. I know Sumner admires Bob Lucas but that is one thing that he’s really wrong about.
September 13th, 2013 at 9:27 pm PDT
link
Mike Sax,
I just remembered, I also have a BA in economics from Delaware. (It’s really sad when you can’t remember what degrees you’ve earned.)
September 13th, 2013 at 9:30 pm PDT
link
Vincent Cate,
I still have problems with this sentence:
“The International Accounting Standard of IAS 29 says there is hyperinflation when “the cumulative inflation rate over three years approaches, or exceeds, 100%.””
Yes, you follow it with the caveats but this sentence is simply not true.
September 13th, 2013 at 9:34 pm PDT
link
Thanks Mark. I have another version.
September 13th, 2013 at 9:48 pm PDT
link
Vincent Cate,
Looks good. Thanks very much for taking my opinions into consideration.
September 13th, 2013 at 9:52 pm PDT
link
Mark, thank you.
Now on to the deflation before hyperinflation question. I claim that deflation is usually defined as something like “reduction in the total money supply including the value of credit”. Further, I claim that as hyperinflation starts and interest rates shoot up such a definition of deflation will always be met. Rapidly rising interest rates causes the value of bonds to cash, loans become much shorter term if at all, and in general “bank made money” seems to contract. So I think the deflation definition will always be met in the early stages of hyperinflation. Can you see what I mean?
September 13th, 2013 at 10:05 pm PDT
link
Vincent Cate,
“I claim that deflation is usually defined as something like “reduction in the total money supply including the value of credit”.”
This is not the conventional mainstream definition of “deflation”. Thus I would not call it deflation as it would be confusing.
“Further, I claim that as hyperinflation starts and interest rates shoot up such a definition of deflation will always be met. Rapidly rising interest rates causes the value of bonds to cash, loans become much shorter term if at all, and in general “bank made money” seems to contract.”
I can see why “bank made money” would probably stop being made but why would the nominal value of existing deposits decline?
“So I think the deflation definition will always be met in the early stages of hyperinflation.”
Do you have eny evidence that these things are actually characteristic of hyperinflations?
September 13th, 2013 at 10:39 pm PDT
link
“This is not the conventional mainstream definition of “deflation”. Thus I would not call it deflation as it would be confusing.”
Maybe what I mean is every “deflationist” I can find on the Internet defines deflation as a contraction of the money supply with a money supply definition including credit and bonds.
Fore sure the bond market will crash as interest rates shoot up. The bond market is huge in any country getting hyperinflation (much larger than the base money supply). So if the bond market is part of a deflationist definition of the money supply then their definition of deflation will be met as the bond market crashes.
I don’t have historical evidence for this, it is just logical to me.
Hyperinflation is always defined as some level of price inflation, never in terms of the money supply. I can not find any deflationist who talks about price level, always money supply with a wide definition of money. So the definitions of deflation I see are not in any way opposites of the definitions of hyperinflation I see. They really can both be met at the same time, and I think they usually are at the start of hyperinflation.
What do you think is the mainstream definition of deflation? Do you know any “deflationist” that uses it? By “deflationist” I mean someone predicting deflation.
September 13th, 2013 at 10:58 pm PDT
link
Vincent Cate,
“Maybe what I mean is every “deflationist” I can find on the Internet defines deflation as a contraction of the money supply with a money supply definition including credit and bonds.”
You can find a lot of things on the internet that aren’t true.
There are very few definitions of money supply that include credit or bonds. In the US for example M4 included commercial paper and T-bills, but it was only officially calculated from 1975-80. Today only the Center for Financial Stability still computes M4 and then only a Divisia measure. In short, money supply generally does not include credit and bonds.
“What do you think is the mainstream definition of deflation?”
Deflation is a decrease in the general price level of goods and services.
“Do you know any “deflationist” that uses it?”
I don’t know any “deflationists” at all.
September 13th, 2013 at 11:27 pm PDT
link
Mark, I backed off my claim about deflation a bit in the FAQ. I will try to look into this more later.
Can I really get away without crossing out major portions of my post? :-) Cool! Mostly it is now reasonable?
September 13th, 2013 at 11:48 pm PDT
link
Vincent Cate,
Yes, in my opinion it’s much better now.
September 14th, 2013 at 12:16 am PDT
link
Mark, thanks much!
September 14th, 2013 at 12:22 am PDT
link
Mark you don’t know any deflationists at all? What about Major Freedom? LOL
September 14th, 2013 at 12:47 am PDT
link
There is Mike “Mish” Shedlock at http://globaleconomicanalysis.blogspot.com/
September 14th, 2013 at 5:34 am PDT
link
Actually I find Mish interesting. But he’s a deflationist judging by his beliefs-he’s against fractional reserve banking, for the gold standard, wants to eliminate the Fed and ‘lots of government programs’ though just like today’s Republicans he prefers not to name even on actual program he’d end.
September 14th, 2013 at 9:31 am PDT
link
@Vincent Cate,
Yes, I’m aware Mish Shedlock once called himself a “deflationist”. But it seemed to me at the time he was merely defining his differences with others over his predictions for the future of the economy. So the use of the word in this manner does not describe a school of economic thought.
Shedlock is a follower of Austrian economic theory, and like many Austrians, he defines inflation/deflation in terms of the money supply and not, as it is more conventionally, in terms of the general price level. But by describing deflation in those terms you would be using the word in a narrow sectarian way.
@Mike Sax,
I knew Major Freedom was a follower of Austrian economic theory, but how could you tell he was a “deflationist”? Isn’t he still around under the name “Geoff”?
September 14th, 2013 at 10:50 am PDT
link
In looking at it a bit more I probably owe Sumner something of a mea culpa at least on stagflation:
“So on stagflation Sumner wasn’t wrong but I wasn’t either, exactly. We were both kind of right but incomplete. However, I had implied that he said something ludicrous and clearly this is not true. On the price level issue it seems that it may turn on the distinction between MOA-MOE. Still ,Sadowski does admit that Sumner could have been clearer here. On a MOE basis the statement that the price level is 100 times as high in Japan as in the U.S. would be ludicrous.”
http://diaryofarepublicanhater.blogspot.com/2013/09/mark-sadowski-responds-sumner-on.html
September 14th, 2013 at 10:53 am PDT
link
“The populations of Belarus, Hungary and Russia have been in steady decline since at least 1993 and all three have rapidly aging populations. And yet inflation was nearly 60% in Belarus, 6% in Hungary, over 5% in Russia last year”
Don’t those countries have to face the Mundell-Fleming trilemma? I’m asking a question here, not sure. It would seem like local circumstances would dominate if you don’t denominate debt in domestic currency and the economy is otherwise smaller than the waves pushing it around.
September 19th, 2013 at 8:11 am PDT
link
[…] thinks there will be almost 11 billion of us in 2100. But other professional demographers are not so sure (sorry, one key story is behind a paywall, but the chart below summarises the conclusions). They […]
September 19th, 2013 at 11:01 am PDT
link
Within the above discussion, there was no mention of assumptions. Yet between the lines one can easily read the assumption of *steady state* economics without periodic motion, business cycles or a season for all things.
”
in short, the period was so far like the present period, that some of its noisiest authorities insisted on its being received, for good or for evil, in the superlative degree of comparison only.
”
~~Charles Dickens~
–A Tale of Two Cities-
Did he also say,
*
It was the best of vacations, it was the worst of unemployment, it was the age of college enrollment, it was the age of mononucleosis, it was the epoch of naïf, it was the epoch of cynicism, it was the season of transparency, it was the season of obfuscation, it was the spring of encouragement, it was the winter of despair, we owned everything, but only through underwater mortgage, we were all going directly to Go, but not to collect $200.
*
? Imprecisely, yet gave us a hint.
Is Mischa a deflationist? In both senses of the word? Can we assume that Mischa exists? If extant, also the culprit who wrote the words? Words blatantly deviating from the party line? If the true writer; does he sincerely subscribe to the ideology of constant deflation for all economic entities?
You cannot know any of these merely from the words written. You can merely hope that Mischa does not take exception to the natural rhythm of economic pendula. Does the long pendulum swing a 360 degree cycle as multiples of 29 years? The short pendulum a cycle of 6 years? One senatorial term? Who knows? One thing for sure:
Cycles are easier for me to eye-ball when displayed as YOY, year over year delta for long cycles. MoM, month over month data for 6 year cycles. Do cycles transfer liquidity from outsider to insider trader? Tell me something :
Which transfers more wealth? Long slow inflation for 29 years then sudden intense 40% deflation of prices in a matter of months? Or long slow deflation for 29 years then 49% inflation of nominal prices during few short months? Tell me something else! Did we have 29 years of deflating long rates before 2010? Conversely, did we have inflation in home prices for long years before homes quickly lost gigantic chunks of nominal value 5 years ago? Think about it!
Grazie
!
September 20th, 2013 at 4:40 pm PDT
link
billyjoerob,
First of all, while Belarus and Hungary are small countries Russia is certainly not. On the other hand I think all three of these countries do have large amounts of foreign currency denominated debt. Debts denominated in foreign currencies expose countries to foreign exchange loss and convertibility risks.
The Mundell–Fleming model has been used to argue that an economy cannot simultaneously maintain a fixed exchange rate, free capital movement, and an independent monetary policy. Combine this with debts denominated in foreign currencies and what you have is a situation where the central bank of a country has an incentive to not allow large exchange rate movements with respect to the currency or currencies in which the debts are denominated.
I haven’t carefully researched the debt situation of these three countries, but I would guess their foreign currency denominated debts are mostly in terms of euros, pounds and Swiss francs, which are all relatively hard currencies (i.e. low inflation rates). The fact that Belarus, Hungary and Russia have high inflation rates relative to the eurozone, the UK and Switzerland seems to contradict your implicit claim that they are importing their inflation rates.
On the other hand the Mundell–Fleming model does not necessarily imply that the debtors have to perfectly align their monetary policies with the creditor countries. They could also try and allow free movement of financial capital and perhaps this is exactly what is going on.
But in the final analysis, doesn’t all of this undermine the demographic hypothesis even more?
September 20th, 2013 at 4:53 pm PDT
link