
Not a monetary phenomenon
Nor was it a fiscal phenomenon, my (post-)Keynesian comrades. Let’s not be glib.
I’m talking about the inflation of the 1970s. Sorry, Milton, I know you got a lot of mileage out of the line, but the great inflation was not at root a monetary phenomenon. Let’s take a look at a graph:
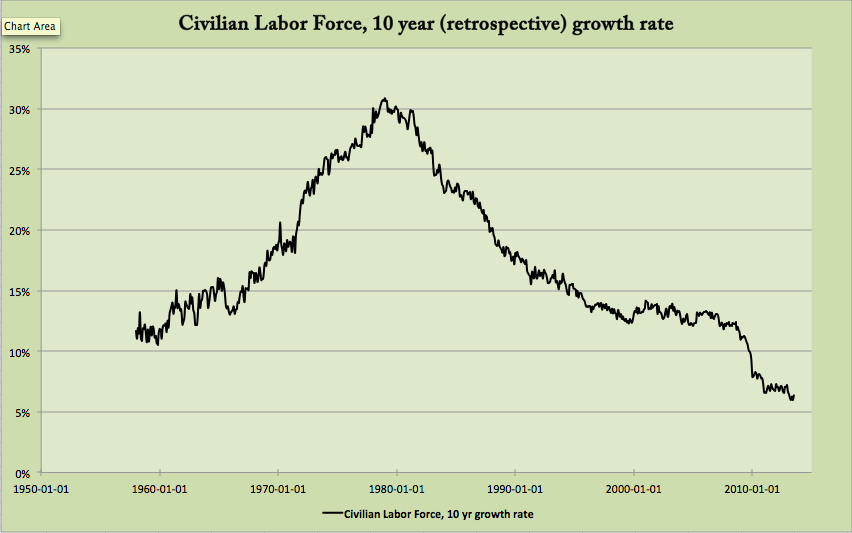
The crucial economic fact of the 1970s is an incredible rush into the labor force. The baby boom came of age at the same time as shifting norms about women and work dramatically increased the proportion of the population that expected jobs.
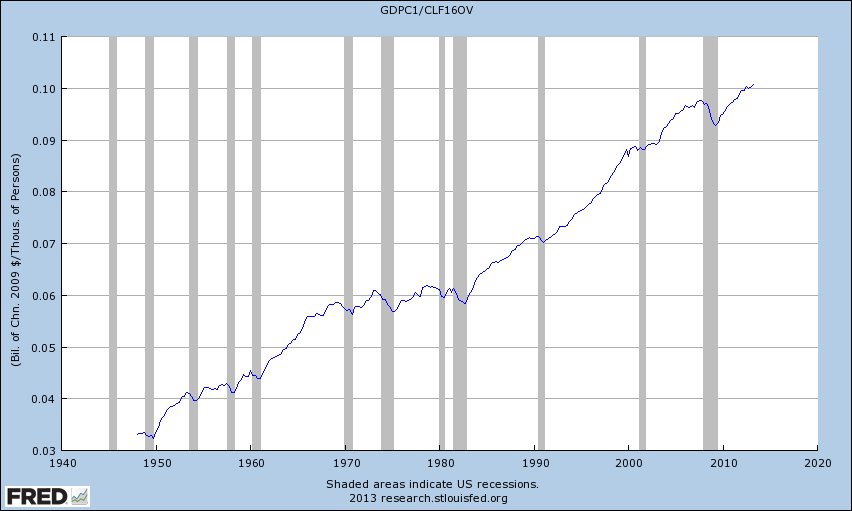
The “malaise” of the 1970s was not a problem with GDP growth. NGDP growth was off the charts (more on that below). But real GDP growth was strong as well, clocking in at 38%, compared to only 35% in the 1980s, 39% in the 1990s, and an abysmal 16% in the 2000s.
What was stagnant in the 1970s was productivity, which puts hours worked beneath GDP in the denominator. Boomers’ headlong rush into the labor force created a strong arithmetic headwind for productivity stats. Here’s a graph of RGDP divided by the number of workers in the labor force. The malaise shows up pretty clearly:
The root cause of the high-misery-index 1970s was demographics, plain and simple. The deep capital stock of the economy — including fixed capital, organizational capital, and what Arnold Kling describes as “patterns of sustainable specialization and trade” — was simply unprepared for the firehose of new workers. The nation faced a simple choice: employ them, and accept a lower rate of production per worker, or insist on continued productivity growth and tolerate high unemployment. Wisely, I think, we prioritized employment. But there was a bottleneck on the supply-side of the economy. Employed people expect to enjoy increased consumption for their labors, and so put pressure on demand in real terms. The result was high inflation, and would have been under any scenario that absorbed the men, and the women, of the baby boom in so short a period of time. Ultimately, the 1970s were a success story, albeit an uncomfortable success story. Going Volcker in 1973 would not have worked, except with intolerable rates of unemployment and undesirable discouragement of labor force entry. By the early 1980s, the goat was mostly through the snake, so a quick reset of expectations was effective.
Fiscal policy could not have solved the problem, unless you posit that new workers would have been more productively employed by government than the private sector was capable of employing them. Contemporary market monetarism could not have solved the problem. Given the huge demographic shift, stabilizing NGDP growth at an arbitrary level would have been a prescription for depression. Market monetarists sometimes hint that NGDP per capita would be a more appropriate growth path target than simple NGDP. Consider: Both supply and demand tend to correlate with work. Workers make stuff, and they also expect to consume more than nonworkers. One might argue, then, that NGDP per member of the labor force would be a good level for a market monetarist to target. Let’s take a look at that:
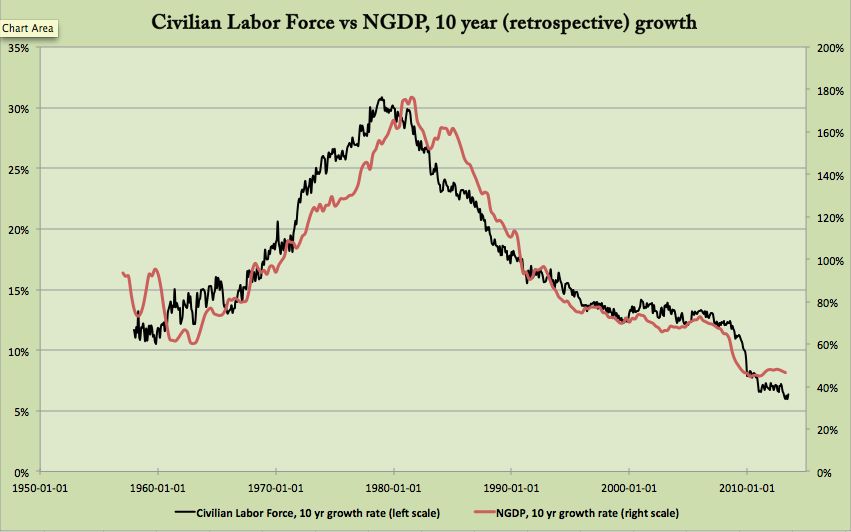
It seems to me that the Fed did a pretty good job of matching NGDP to workers in the 1970s. If anything, they were a bit too tight, but permitted some catch-up growth in the 1980s to offset that.
Since the 1970s, macroeconomics as a profession has behaved like some Freud-obsessed neurotic, constantly spinning yarns about how the trauma of the 1970s means this and that, “Keynes was wrong”, “NAIRU”, independent (ha!) central banks. A New Keynesian synthesis made of output gaps and inflation and no people at all, just a representative household reveling in its microfoundations. Self-serving tall tales of the Great Moderation, all of them.
It was the people wut done it, by being born and wanting jobs. Even the ones without penises.
Oh, and give poor Arthur Burns a break. You couldn’t have done any better.
Mr. Fluidity, “simply unprepared for the firehose of new workers. The nation faced a simple choice: employ them, and accept a lower rate of production per worker, or insist on continued productivity growth and tolerate high unemployment. Wisely, I think, we prioritized employment. But there was a bottleneck on the supply-side of the economy. Employed people expect to enjoy increased consumption for their labors, and so put pressure on demand in real terms.”
And once again, the nation faces a simple choice: offer working age people enough lucre to enjoy increased consumption, or get a middle finger as they slack as much as they can get away with. Geezers ain’t getting nobody to work cheap, except the desperate, ignorant and stupid.
September 5th, 2013 at 5:25 am PDT
link
And slacking is the best case. Other tykes will disturb the boomers’ and wwii generations’ systems for fun, profit, or sheer spite.
September 5th, 2013 at 6:13 am PDT
link
You heard it here folks, Steve Randy Waldman is a conservative: ” Workers make stuff, and they also expect to consume more than nonworkers”.
To this rust belt kid, the 1970’s are about:
1. the stagnation of the steel industry – we overbuilt here. Especially, if we were going to face 2-4.
2. the energy crisis
3. unions
4. price controls, rationing and a general unwillingness of the govt. to let the market run free. Jesus, Nixon is what passed for a conservative!
5. huge amounts of crime and boarded up buildings.
I can understand why “some types of people” would like to try to unlearn on the lessons of Reagan, see 1-5, and instead make it seem like it was just having just a bunch of glut of labor causing a lack of productivity gains, so inflation….
BUT!
In solving America’s problems, I deliver 30M new workers into the system in one year:
http://www.morganwarstler.com/post/44789487956/guaranteed-income-choose-your-boss-the-market-based
And do we expect inflation as the properly priced labor – labor which admits it is getting welfare during wage negotiations – to increase?
No.
We do expect higher overall wages to eventually increase as there are no more unemployed, but while those 30M sift into the mix, we expect costs to fall.
Lower priced labor = lower price product… if not, whatever is causing that is THE problem.
Sticky wages and prices can be real. But if there are policies that PROMOTE those, then that’s the problem. Grokking sticky wages is not the same as promoting them. One is analytical, the other is evil.
Final Note: REMEMBER getting the MOST NGDP growth is not the goal. Getting a super predictable stable NGDP growth, that sacrifices the highs to keep off the lows, is the strategy.
September 5th, 2013 at 7:14 am PDT
link
But there was a bottleneck on the supply-side of the economy. Employed people expect to enjoy increased consumption for their labors, and so put pressure on demand in real terms. The result was high inflation, and would have been under any scenario that absorbed the men, and the women, of the baby boom in so short a period of time. Ultimately, the 1970s were a success story, albeit an uncomfortable success story. Going Volcker in 1973 would not have worked, except with intolerable rates of unemployment and undesirable discouragement of labor force entry. By the early 1980s, the goat was mostly through the snake, so a quick reset of expectations was effective.
By the 1980s, early boomers were becoming thirtysomethings whose consumption was actively channeled into financial products and services thereby redirecting ridiculous levels of wage/price inflation into to financial assets and eventually to fantasy assets aka derivatives. Maybe Volcker gets too much credit.
September 5th, 2013 at 12:55 pm PDT
link
Why would a 30% increase in labor force lead to a 180% increase in NGDP?
September 5th, 2013 at 1:15 pm PDT
link
Even using NGDP/Labor force the 70s saw a highly expansionary policy. I find hard to believe that mantening their previous NGDP/Labor force trend level would lead to bigger unemployment.
http://research.stlouisfed.org/fredgraph.png?g=m6x
Also, where almost as close to the pre 70s NGDP/Labor force trend level than the pos 70s NGDP/Labor Force trend level. Maybe the economy spend all these years overheated and the fed is trying to disinflate to the previous trend.
September 5th, 2013 at 4:09 pm PDT
link
I am concerned with a graph that conveniently show a base level, a growth peak, & then a base level.
What was the affect on productivity of the unexpected expansive in rush of immigrant workers through out America’s history? What were the affects of the similar baby boom’s through out the world? While the US baby boom was fairly large for the US when you look at age pyramids throughout out the world is really was not that extreme.
Your argument, the employment boom was part of what cause the 1970’s inflations, is interesting. The truth is that you give no real rational as to why the boom caused declining productivity. I think you are right the productivity declined due to an increase number of worker but I have seen no statistics that show a world correlation with population growth & declines in worker productivity.
My counter argument is that it declined because restrictive labor rules, union-employer turf wars, government interventions/manipulations, & uneven global markets prevented them from being productively employed. A different system, with lighter control & more flexibilty could have allowed the workers to be as productive as in the past
This could have could have generated growth more like 2000’s coastal China where additional workers migrating from inland China, directly added to the countries growth w/o decreasing productivity gains.
September 5th, 2013 at 6:40 pm PDT
link
As slotowner says, the history of a single episode is not really proof. Demographic bulges (often baby booms but not always) of various intensities and durations have occurred in many countries throughout history. There are other episodes to examine further back in US history, and also in Japan, China, most European countries, and Australia. It is important to look at these experiences too. India is currently in a situation with a lot of people entering the work force, but it has been for a long time.
I think the following sentence needs further explanation: “Employed people expect to enjoy increased consumption for their labors, and so put pressure on demand in real terms.” The mechanism is that young people in the early years of their careers tend to borrow and spend. Banks can always lend because they create deposits. The new deposits are spent on consumption and a lack of ability of productive capacity to expand to the same extent results in high CPI inflation. A low proportion of the population wants to hold financial assets, and so a low proportion of the new tend to be converted into bank bonds and term deposits.
As these people progress through life, they become more interested in longer term investments and financial assets, and then a period of high assets inflation (bubbles), low interest rates and low CPI inflation ensues.
I suspect that the monetary environment affects how this plays out to some extent, but it is interesting to note that for a while before Volcker, the Fed didn’t really try to set or control interest rates. Interbank rates fluctuated quite dramatically, but averaged something similar to the inflation rate. QE would probably have been required to produce a looser monetary policy, and under those conditions you’d expect even higher inflation. Changing the mix of tax loading between consumption and investment might have allowed further expansion.
September 5th, 2013 at 7:53 pm PDT
link
Its a fascinating point you make about demographics but I don’t see how that can explain all of it.
Didn’t the 1970s exhibit dramatic real wage growth over and above inflation and then for the 1980s and 1990s that switched over to real productivity growth per worker without real wage growth?
On the face of it, having a “fire-hose” of new workers might be guessed to DEPRESS wages as there would be a glut. If a firm had only so many machines and so could not absorb new workers, then they could simply choose not to employ them.
Even if a second baby boom had come along starting in 1980, I suspect a great moderation could still have been engineered in the same way by an interest rate spike, union busting legislation (and a consequent cohort of unemployed to scare off wage demands)and liberalization of consumer credit provision.
To me a big part of the great moderation still looks to be down to capital flows from the developing world to the developed world because of changes that made the developed world “money friendly” rather than “worker friendly”. The currency exchange rate consequences of that allowed the developed world to get all of the worlds supply of commodities.
What do you make of the Singapore policy of using demographics as an economic tool? What about the Open Borders campaign?
September 6th, 2013 at 2:59 am PDT
link
vbounded — I won’t make any predictions, but I hope we come up with some better options than you suggest!
Morgan — Lots of stuff happened in the 1970s, and I’d be the last to deny that details can matter in complicated ways. But the theory I’m competing with here, “always and everywhere a monetary phenomenon”, is an equally reductive theory. That the demographics of the workforce might explain changes in prices is a pretty obvious idea, and in practice it explains the Great Inflation pretty well. Yet it’s rarely discussed, because it serves no one’s agenda. It’s a “supply side” story, but one where to root of the problem is fecundity, rather than government interference or inaction. It does nothing to resolve the disputes between Keynesians, Monetaristists, and small-government supply-siders that have dominated debates since the 1980s.
Emma — The life-cycle angle is interesting. It’s certainly true that as boomers entered the labor force, initially their incremental income would have translated very directly to an increase in demand, while as they grew older, growth in boomer income would add less and less to demand as they used the surplus to purchase financial assets rather than goods and services.
kebko — Eyeballing from the graph, each percentage point of 10-year labor force growth was associated with to roughly 5.9% points of 10-year NGDP growth. That relationship remains fairly consistent over the entire period, so a 30% growth rate in the labor force “explains” about 177% 10-year growth rate in NGDP. Another way to see this is to note that the growth rate of NGDP/worker was fairly constant. Check out the graph that Arthur points to, the log of NGDP/worker. [ http://research.stlouisfed.org/fredgraph.png?g=m6x ] In this sort of graph, the slope of the graph represents the growth rate. You can see that throughout the 1970s, it was pretty constant, close to but just a bit higher (steeper) than the also quite constant growth rate of the 1960s. Over the whole series, the kinks that stand out are a brief period of steep growth in the early 1950s (also associated with high inflation) and a kink (a downshift in growth) in the mid-1980. I’ll talk about this a bit more below.
September 6th, 2013 at 5:37 am PDT
link
Steve, GI CYB adds 30M new workers to economy over next year….
Overall average wage goes down. This is supply / demand. My system actively hunts and kills sticks wages / prices.
The effect is 30M working for as little as $1 per hour. Avg. price of manhour goes down. Overall productivity goes way UP.
And again, this happens bc I hunt down and kill sticky wages.
You took at massive increase in labor (supply), followed by massive increase in inflation (price), and then violate supply / demand…
The reason your model works is bc you didn’t hunt down and kill sticky wages. That’s the CAUSE.
IF you hunt down and kill sticky wages / prices, THEN supply / demand functions properly.
The labor supply shock IS SUPPOSED to drive down wage prices. If not… well there’s some gum in the gears – I and others here listed my #1-5.
My point is, you don’t get to both argue sticky wages prices are a fact AND not also hunt and kill them. You don’t get to throw brick thru window and sell insurance.
And you are willfully, trying to NOT LOOK AT what was causing stickiness in the 1970’s, rather than admit it has an effect. Supply / demand is a fact. The effect of GI CYB on prices is a FACT. Also, it is a fact, you are not a known champion of blaming sticky policies – because you LIKE them.
In 1971, this happened:
http://en.wikipedia.org/wiki/Nixon_Shock
If this didn’t happen, if we hunted down and killed massive monetary inflation, 30M would enter labor force, and instead of a willful effort to use inflation to support wages / prices, we’d make everyone confront productivity gains as prices fall.
But you LIKE the Nixon Shock, you want to assume it into your calculus, also you want to assume unions, regs, etc.
Reagan came in and reversed those things: shrink money supply, crush unions, crush regs, etc.
Hunting and killing sticky wages / prices works, but more importantly, MORALLY you can’t both argue they are a fact that forces us to inflate AND champion their existence.
MORALLY that is wrong.
September 6th, 2013 at 6:24 am PDT
link
Arthur — Your point is well taken. It’s true that even on a NGDP/CLF basis, the monetary policy of the 1970s was a bit looser than usual. For the 65 years for which we have data (1948-2012 inclusive), the average compound 1-year growth rate in NGDP/CLF was 5.0%. By decade, the numbers were 5.6% (1950s), 5.0% (1960s), 7.4% (1970s), 6.0% (1980s), 4.2% (1990s), and 3.1% (2000s).
So the 1970s are an outlier in terms of loose money, even adjusting for the size of the workforce. But that fact suggests a few questions:
Why was money, by this measure, a bit looser in the 1970s and 1980s than in earlier periods? Certainly the explanations given at the time were precisely about the intolerability of high unemployment. Was it really just to help Nixon? Even Ford and Carter after the whole WIN thing? You say that you don’t think hewing to the previous trend would have created unemployment. I don’t know, but the Fed certainly knew inflation was a problem; they were actively trying deflect the blame. The question is, why was unemployment such a vexing problem in the 1970s, despite looser policy by this measures, and much looser policy under conventional measures? My answer is that there were just too many people trying to be absorbed too quickly. Do you have another answer? It strikes me as far too glib, as monetarists often seem to, to say that policy was simply too loose. Was the perception that tighter money would lead to higher unemployment simply wrong?
We seem to agree that NGDP/CLF is an interesting standard for monetary policy. If we accept this standard, note even if the 1970s had, like the 1960s, hewed to the long-term average, by most common measures (constant money growth, constant NGDP growth, constant per-capita NGDP growth) monetary policy would still have been extraordinarily loose in the 1970s. Any usual monetary policy rule would likely have led to a serious depression in the 1970s, if NGDP/CLF was anything like an appropriate rule. (At least for this period, I do think it was a better rule than NGDP or NGDP per capita would have been! It is certainly the closest to the rule actually followed, even with the small deviation towards loose!)
September 6th, 2013 at 7:01 am PDT
link
slotowner — Unfortunately, stats for the civilian labor force begin in 1948. We have just one big boom to look at.
But I think it’s important to point out that immigration booms, and especially China’s urban population boom, are very, very different beasts, because contemporary endogeneity is a much bigger issue. The millions of rural Chinese moving to cities are not force-injecting themselves into an otherwise stable economy. They are choosing, at great personal cost, to uproot themselves precisely because contemporary urban China offers unusual economic opportunities. The baby boom / women-in-the-workplace event is much closer to an “exogenous” injection into an economy that was not at the time growing at any extraordinary rate or undergoing a major change in economic institutions.
It will in general be hard to find “clean” migrations by which to test this hypothesis. Usually migrations occur because people are experiencing hardship at home (in which case low productivity can be explained by damaged human capital) or because they know the destination is hiring, which selection bias might prevent us against finding a productivity slowdown. There are also confounds associated with language, culture, etc. Population booms are the best. They are somewhat endogenous, sure, because the parents were optimistic 20-years prior to workforce entry. But, if we posit that parents cannot in fact predict 20-year forward economic conditions very well, we can argue that the injection is not caused by unusually good or poor opportunities to begin with (although by chance a baby boom could find itself entering the workforce in unusually good or difficult times). Another way to try to test this would be to look at the one-time change in labor force participation associated with women entering the workforce elsewhere. There’s also some endogeneity there, but we might argue that culture and politics cause that change more than opportunity per se, and expect to find some difficulty (reflected by productivity stats) concomitant with other countries’ absorption of women, if it happened quickly enough.
There are lots of potential specific stories about what went wrong in the 1970s. But my argument is that we don’t much have to resort to them. The base case should be that such dramatic and unusual change in the number of workers would lead to problems. Obviously, in reality, those problems took specific forms. But it is the China scenario, or the US post-Civil War urban migration scenario, that is unusual. Usually economies are growing and changing more slowly and stably than during a major industrialization event, and they are going to have a hard time adapting to a very large influx of workers.
September 6th, 2013 at 7:22 am PDT
link
Unanimous — I agree that one episode is not a proof of anything, but despite that, the episode in question provoked massive and in my opinion unwarranted and very destructive changes in the views of macroeconomists. I’m trying to counter those changes here. I think the evidence for a demographic explanation is at least as strong as any evidence of misguided policy, and that post-Volcker triumphalism may well just be the fundamental attribution error in action.
With you and with Emma above, there are interesting things one can say about the role of banking and lifecycle borrowing and spending vs investing decisions. But though that may be a part of the story, you really can cover a lot of ground based on demographics alone. The explanations (mine, yours, also the conventional explanations) aren’t mutually inconsistent. Perhaps they all played a role. But to rely on the conventional story alone, as economists typically do, blaming the Fed and Keynesian impulses for the 1970s and congratulating Volcker for the 1980s, seems to me to ignore a great deal. Nothing can be proven from a single historical event, sure, but we have to come up with explanations. Evidence and parsimony would not choose the conventional story as the most likely explanation. Conventional wisdom has been shaped in the interests of those who define the conventions.
September 6th, 2013 at 7:31 am PDT
link
Stone — Check out a graph of real (average) wages and salaries per member of the labor force: http://research.stlouisfed.org/fred2/graph/?g=m7p Consistent with this account, the 1970s were not a good time in the US for real wage growth. The median labor-force-member would have done worse than this, because salaries are right-skewed. Tyler Cowen starts dates Great Stagnation to 1973 when, he observes, median compensation and GDP growth begin to diverge.
I’m skeptical of your engineering-a-Great-Moderation despite demographics. Remember, the problem then was too much demand, not too little, so you wouldn’t want a 2000s style credit boom or a 1990s style equity bubble. I suppose you could have everyone unemployed or earning very low wages and manage credit growth to create just enough demand not to provoke inflation. But, as we’ve seen, using credit to augment insufficient wages is a self-limiting strategy, and one that tends to engender little satisfaction or optimism (absent a boom in some leveraged asset purchased).
September 6th, 2013 at 7:42 am PDT
link
Morgan ‐ I’d be glad to combat the stickiest price, which I consider to be at the root of most price and wage stickiness!
September 6th, 2013 at 7:45 am PDT
link
Morgan — I object to certain kinds of attempts to “break” stickiness: I object to trying to reduce people’s compensation relative to their real and financial obligations. But I don’t object to your proposal on those ground, as you place a string wedge between the amount of money people pay, and the compensation workers receive. That is, you break sticky prices from the perspective of the buyer while retaining them via government subsidy from the perspective of the seller. Which strikes me as a fine thing to do. But if I’m a conservative, you’re a damned communist!
September 6th, 2013 at 7:59 am PDT
link
[…] a new post, Steve Waldman suggests that the inflation of the 1970s was not a monetary phenomenon. I have two issues with […]
September 6th, 2013 at 9:00 am PDT
link
Steve, you demand safety net, so I go along with your commie proposal.
In return, I demand we price the unused labor honestly – admitting they are now getting a safety net, so you go along with my evil market driven clearinghouse.
You then demand, the hedonic boost joy – we don’t force those in safety net to be as productive as possible (take highest paying job).
I grudgingly agree and in return insist that Fortune 1000 can’t access this labor pool, to encode smallness.
That’s how I negotiated this out in my head for progressives.
——
On debt, we kind of agree. t But to me, the value of the money doesn’t have to depreciate very much, if at all, to me the key is to tax fixed interest based income much higher than capital gains from dividends (equity). And similarly to apply transaction tax to buying and selling equities, to force people into long dividend driven positions, and out of public markets.
Yes this means the govt. can only borrow at very high rates. Which means they have to run closer to account balance.
Instead all savings is constantly and forever forced into equity, preferably in privately owned entities… you win or lose, ONLY ON whether or not the thing you invest in actually PAYS OFF.
There shouldn’t be “safe” assets. That’s my goal.
Remove safe assets, and the value of young people goes up, the value of entrepreneurs goes up, the value of main street goes up, but the value of traders, and the capital class, and govt goes down.
We get far greater technological and economic churn. This means more innovation and more class mobility.
Your venture goes HUGE, you make $1B. How do you keep it at $1B?!? The only way to do it is to take long term positions in new companies, and hope they pay off.
All the money has to go somewhere, but it will be easier for Steve to start a lemon-aid stand (where investors get paid on your profits), than for to borrow money to buy a couch (the interest you’d pay is taxed).
I don’t have this mechanized like GI CYB, but I aim to make issuing the very debt you don’t like, very hard to do in the first place.
September 6th, 2013 at 9:30 am PDT
link
It is incorrect to believe that demographics [‘baby boom’] created jobs, which is much more a function of average -Rate- of economic profit, capital accumulation, new technologies, etc. Many more women entered the labor force partially due to second phase feminism but more so to offset husband’s/relative’s falling real wages.
Rate of Profit and Accumulation —
http://www.marxisthumanistinitiative.org/wp-content/uploads/2011/11/Fig.-5.8.jpg
Real Wages for nonsuper visory employees, 1964-2008 —
https://plus.google.com/photos/106703961701137172594/albums/5195760215722236945/5200404157632314674?banner=pwa&pid=5200404157632314674&oid=106703961701137172594
September 6th, 2013 at 9:38 am PDT
link
Steve @15 “I’m skeptical of your engineering-a-Great-Moderation despite demographics. Remember, the problem then was too much demand, not too little, so you wouldn’t want a 2000s style credit boom or a 1990s style equity bubble. I suppose you could have everyone unemployed or earning very low wages and manage credit growth to create just enough demand not to provoke inflation. But, as we’ve seen, using credit to augment insufficient wages is a self-limiting strategy, and one that tends to engender little satisfaction or optimism (absent a boom in some leveraged asset purchased).”
That is right, I was meaning a boom in some leveraged assets alongside enough unemployment to keep wages down (by the way I’m not a fan of this I’m just trying to unpick how it “works”). I think that was crucial for the great moderation because that enticed in capital flows. And I think a lot of the 1970s inflation is down to global commodities rather than down to too much demand within the USA or UK. Most of the world is not in the USA nor the UK. If the billions of people outside the USA (or UK) can pay more RELATIVE to those in the USA or UK for oil or grain, then prices as seen by us in our currencies will go up. So exchange rates have a massive impact on inflation. And exchange rates get driven by capital flows to asset markets. You need a boom in some leveraged assets to get the inward capital flows to shift exchange rates to bring down the cost of global raw materials for domestic consumers. Elsewhere in world those very same global commodities will be becoming unaffordable for people in countries on the other side of the exchange rate shifts. This is happening even now comparing India and USA. India now is having its stagflation moment because the Indian currency has weakened.
Commodity prices (in USD) plummeted during the great moderation because outside the developed world, billions of people were excluded from being consumers because their currencies weakened due to capital flows from the developing world to the developed world asset markets (eg Nigerian Naira/USD exchange = 1980 1Naira, 1985 3Naira, 1990 9Naira, 1995 50Naira , 2000 100Naira).
September 6th, 2013 at 10:06 am PDT
link
[…] For All Investors (Forbes) • The root cause of the high-misery-index 1970s was demographics (Interfluidity) • U.S. Car Sales Soar to Pre-Slump Level (WSJ) • The Perils When Megabanks Lose Focus (NYT) […]
September 6th, 2013 at 10:11 am PDT
link
Juan de la O,
I have to say I hate graphs like Real Earnings (2008) set to 1970, it gives a horrible impression that the quality of life isn’t many factors better today.
Without absolute foresight that the Internet would happen, I’d never trade what I’d have now as a poor guy, for what I’d have in 1994 as rich guy. If I was just shown both worlds, and told that was my choice… I choose relative lower status for this level on consumption.
Essentially, the very low tech that kept the service support system / manufacturing in the relative money, is to terrible to comprehend.
September 6th, 2013 at 11:11 am PDT
link
Steve, you’re right that we agree that NGDP/CLF is a good measure of monetary policy, and by this measure the policy was not as expansionary as people assume.
And I should really consider that it was needed to avoid unemployment, as they seemed to believe back them.
But I would like to understand the mechanism underlining your theory better. Why would a bigger labor force need a higher NGDP / Labor Force?
The distribution of wage became more skewed to the left, and needed an inflation rate higher than the one needed to low the mean wage to lower the median wage?
September 6th, 2013 at 11:52 am PDT
link
[…] For All Investors (Forbes) • The root cause of the high-misery-index 1970s was demographics (Interfluidity) • The Perils When Megabanks Lose Focus (NYT) see also Bogged-Down Banking Fight Leaves EU […]
September 6th, 2013 at 1:04 pm PDT
link
The problem with the idea that demographics or lackluster productivity growth is driving NGDP growth is that NGDP growth was nearly universally too fast in the advanced world in the late 1960s through the early 1980s and yet not every country was undergoing a boom in labor force growth or suffering from slow productivity growth.
The following annual data comes from AMECO (NGDP from 1960), the OECD (civilian labor force from 1955/1956) and the Conference Board (RGDP from 1950).
Here are some counterexamples.
1) West Germany
Peak NGDP growth is 141.1% in 1967-77 when civilian labor force growth was 2.4%. Peak civilian labor force growth is 10.4% in 1980-90 when NGDP growth was 65.7%.
2) UK
Peak NGDP growth is 344.4% in 1971-81 when civilian labor force growth was 6.2%. Peak civilian labor force growth is 10.0% in 1998-2008 when NGDP growth was 63.2%.
3) Spain
Peak NGDP growth is 476.7% in 1970-80 when civilian labor force growth was 5.4%. Peak civilian labor force growth is 33.7% in 1997-2007 when NGDP growth was 109.1%.
4) Netherlands
Peak NGDP growth is 224.6% in 1966-76 when civilian labor force growth was 8.3%. Peak civilian labor force growth is 19.8% in 1992-2002 when NGDP growth was 73.4%.
5) Sweden
Peak NGDP growth is 210.9% in 1973-83 when civilian labor force growth was 10.5%. Peak civilian labor force growth is 13.0% in 2002-12 when NGDP growth was 45.5%.
6) Austria
Peak NGDP growth is 180.5% in 1967-77 when civilian labor force growth was (-3.2%). Peak civilian labor force growth is 15.4% in 1985-95 when NGDP growth was 69.3%.
7) Ireland
Peak NGDP growth is 513.8% in 1971-81 when civilian labor force growth was 12.2%. Peak civilian labor force growth is 46.1% in 1997-2007 when NGDP growth was 176.9%.
8) Luxembourg
Peak NGDP growth is 179.6% in 1964-74 when civilian labor force growth was 17.0%. Peak civilian labor force growth is 48.1% in 1998-2008 when NGDP growth was 114.6%.
Furthermore several of these nations had significantly higher productivity growth (RGDP per labor force member) when NGDP growth was at peak than when civilian labor force growth was at peak. West Germany, Spain, the Netherlands and Austria had productivity growth of 40.6%, 52.8%, 43.8%, 63.1% respectively during the decades when NGDP growth was at peak, and productivity growth of 10.6%, 10.2%, 12.9%, 13.1% respectively during the decades when civilian labor force growth was at peak.
Was there a depression in any of these countries when civilian labor force growth hit its peak despite the much slower rates of growth in NGDP? In particular was there a depression in those countries where productivity growth was also much slower?
West Germany, Spain, the Netherlands and Austria had unemployment rates of 5.0%, 8.3%, 3.1% and 3.9% respectively in 1990, 2007, 2002 and 1995 respectively. (These are harmonized unemployment rates with the exception of West Germany.) West Germany’s rate was not a record for the post-WW II period but it was higher than it had been prior to 1982. Spain’s unemployment rate was the lowest since 1979, nearly 30 years previously. The Netherland’s unemployment rate was lowest ever except for the previous year (2.6%) on records extending back to 1983. Austria’s unemployment rate has only been lower three times since then and never lower than 3.6%.
September 6th, 2013 at 1:49 pm PDT
link
[…] http://www.interfluidity.com/v2/4561.html […]
September 6th, 2013 at 4:20 pm PDT
link
SRW,
If your hypothesis is correct, then we face some real problems in the next two decades in Europe and especially China, where aging of society occurs rapidly, aggregate demand falls, and strong deflationary pressures emerge.
September 6th, 2013 at 5:35 pm PDT
link
[…] Sumner replies to my claim that the great inflation of the 1970s wasn’t a monetary phenomenon by saying, yes, in fact it […]
September 7th, 2013 at 1:28 am PDT
link
Productivity was low but employment was high because we all went to grad school.
September 7th, 2013 at 7:41 am PDT
link
[…] Could the inflation of the 1970s have been avoided? (Interfluidity) […]
September 7th, 2013 at 8:00 am PDT
link
[…] Randy Waldman delivers another Aha! post (and a followup reply to Scott Sumner) pointing out a huge driver of the 1970s Great Inflation […]
September 7th, 2013 at 11:39 am PDT
link
[…] Randy Waldman delivers another Aha! post (and a followup reply to Scott Sumner) pointing out a huge driver of the 1970s Great Inflation […]
September 7th, 2013 at 11:40 am PDT
link
[…] Randy Waldman delivers another Aha! post (and a followup reply to Scott Sumner) pointing out a huge driver of the 1970s Great Inflation […]
September 7th, 2013 at 11:49 am PDT
link
[…] light of the recent discussions of inflation in the 1970′s (Steve Roth and Steve Randy Waldman), I ask… how well has the Federal Reserve done in setting a Fed rate to balance inflation […]
September 7th, 2013 at 4:30 pm PDT
link
[…] light of the recent discussions of inflation in the 1970′s (Steve Roth and Steve Randy Waldman), I ask… how well has the Federal Reserve done in setting a Fed rate to balance inflation […]
September 7th, 2013 at 4:36 pm PDT
link
[…] is what Steve Randy Waldman (SRW) wants us to believe, being highly praised by Steve Roth at Angry Bear who says that´s the […]
September 7th, 2013 at 6:04 pm PDT
link
[…] light of the recent discussions of inflation in the 1970′s (Steve Roth and Steve Randy Waldman), I ask… how well has the Federal Reserve done in setting a Fed rate to balance inflation over […]
September 7th, 2013 at 8:41 pm PDT
link
Employed people expect to enjoy increased consumption for their labors, and so put pressure on demand in real terms. The result was high inflation, and would have been under any scenario that absorbed the men, and the women, of the baby boom in so short a period of time.
Steve, could you explain this part more thoroughly? Because it seems to me that if you spell it out in complete detail, you would have to add in some monetary premises to get the result. One way for the economy to accommodate an influx of wage-earners and an X% increase in hours worked with a smaller Y% increase in output would be for the real wages of workers to rise more slowly than output. And that can happen if there is no infatuation but nominal wages rise faster than output too. If instead the X% increase in hours worked leads to an X% increase in the dollars that are pressed into work in the marketplace to bid for goods, which then puts upward pressure on prices since output is rising more slowly, then that must be because wages are sticky. And that leads to a monetary conclusion of some kind right? The society must be generating more aggregate money wages as hours increase.
I’m not saying the money wage growth is the sole cause of inflation, but a kind of “without which not” contributing cause. From a moderate endogenous money perspective, whatever it is that enables workers to successfully demand increases in money wages that keep pace with the increase in hours worked, is the force that can drive the demand for money.
I suppose another way wages could keep up with hours, if there is no monetary growth, would be a higher real percentage return to labor, and a draw on the monetary savings of business owners or a reduction in retained monetary earnings. Assuming workers consume more than the ownership class who are relative savers, that would create inflationary pressure.
But ultimately, prices are the rate of exchange of goods and services for money, so money has to come into the picture somewhere. And increase in the total amount of human want for goods and services won’t raise their prices unless people in the aggregate have the ability to convert their wants into a commensurate increase in the monetary bid for those goods and services.
Also you describe the response of the 70’s economy to the influx of workers as prioritizing employment. But there was very high unemployment in the 70’s. As high as 9% and ending the decade at around 7.5% right? Wasn’t that a big part of what the “malaise” was all about? (It was about other things too, but that’s for another time.)
September 7th, 2013 at 9:24 pm PDT
link
Oops … spell checker corrected my typo for “inflation” with “infatuation”.
September 7th, 2013 at 9:26 pm PDT
link
[…] Sandowski (in comments here and here) and Scott Sumner challenge me to support my thesis that inflation is related to […]
September 8th, 2013 at 7:21 am PDT
link
[…] any case Steve Waldman suggested a few posts back that the Great Inflation was a reasonable response to the Baby Boomers entrance […]
September 8th, 2013 at 5:06 pm PDT
link
[…] Not a monetary phenomenon […]
September 10th, 2013 at 10:48 am PDT
link
Steve, demographics almost certainly played a role, but imo, this factor was far, far less important than the Saudis taking control of the marginal price of crude in the late 1960s, early 1970s.
As an aside, Diane Macunovich has done a lot of work on demographics that’s worth a look. See her book Birthquake and more recent papers here: http://www.iza.org/en/webcontent/personnel/photos/index_html?key=1415. John Geanakoplos also co-wrote a paper (~2001?)that extended the theoretical foundations of her empirical work.
September 11th, 2013 at 10:27 am PDT
link
Arturo,
“Steve, demographics almost certainly played a role, but imo, this factor was far, far less important than the Saudis taking control of the marginal price of crude in the late 1960s, early 1970s.”
Why do people still believe in this zombie myth?
World nominal crude oil prices can be found here:
http://econ.worldbank.org/WBSITE/EXTERNAL/EXTDEC/EXTDECPROSPECTS/0,,contentMDK:21574907~menuPK:7859231~pagePK:64165401~piPK:64165026~theSitePK:476883,00.html
The US GDP implicit price deflator can be found here:
http://research.stlouisfed.org/fred2/series/A191RD3A086NBEA
Real world crude oil prices (in 2009 dollars) fell from $7.59 a barrel in 1965 to $5.31 a barrel in 1970, or by 30.0%, and then rose to $82.99 a barrel in 1980, or an increase by a factor of 15.62. For comparison real world crude oil prices rose from $16.54 a barrel in 1998 to $97.74 a barrel in 2008, or an increase by a factor of 5.90.
However let’s look at expenditures on petroleum. Expenditures by energy source can be found here:
http://www.eia.gov/totalenergy/data/annual/pdf/sec3_11.pdf
Combine that with the GDP figures from this:
http://www.eia.gov/totalenergy/data/annual/pdf/sec1_13.pdf
And what you’ll find is the following.
Expenditures on petroleum rose from 4.6% of GDP in 1970 to 8.5% of GDP in both 1980 and 1981, or an increase of 3.9 points. For comparison expenditures on petroleum rose from 2.6% of GDP in 1998 to 6.1% of GDP in 2008, or an increase of 3.5 points.
Core inflation rose from 1.3% in 1965 to 4.7% in 1970 to 9.2% in 1980:
http://research.stlouisfed.org/fred2/graph/?graph_id=109579&category_id=0
But core inflation only rose from 1.2% in 1998 to 2.3% in 2008.
So the increases in the proportions of GDP spent on oil are virtually identical and yet core inflation did not soar in the 2000s. Thus the idea that oil prices caused the Great Inflation makes little sense to me.
Now, this raises a legitimate question, how is it that real world crude oil prices can go up nearly 16 fold and the amount spent on petroleum *less* than doubles in the 1970s, and the real world crude oil price goes up nearly 6 fold in the 2000s and the amount spent on petroleum *more* than doubles?
One issue is that *US* crude oil prices did not rise anywhere near that much in the 1970s. The real US price of oil was $14.35 a barrel in 1965, $13.52 in 1970 and $77.39 in 1980, so US crude oil prices only rose by 5.72 fold in the 1970s:
http://research.stlouisfed.org/fred2/graph/?graph_id=136738&category_id=0
Until 1979 US crude oil prices were significantly higher than world crude oil prices, and as of 1965 and 1970 imported oil represented only 19.8% and 20.7% of total oil consumption respectively:
http://www.eia.gov/totalenergy/data/annual/pdf/sec5_6.pdf
Furthermore the price of crude oil relative to the consumption price was a lot lower in 1970 than it was later.
If you take the average daily consumption figures from the link just above and multiply them by 365 you can convert them to annual averages. Then take the annual expenditures and divide them by the consumption amounts you’ll get the average consumption price of petroleum products. Then finally convert them to real prices using the GDP implicit price deflator and this is what you will find.
The real consumption price of a barrel of oil rose from $35.98 in 1970 to $85.64 in 1980 or by 138.0%. For comparison the real consumption price of a barrel of oil rose from $33.56 in 1998 to $122.34 in 2008 or by 264.5%. Thus the impact of the oil price increases on the price of a barrel of oil to the consumer was actually far worse in the 2000s than in the 1970s.
It’s interesting to note that US crude oil prices were 37.6% of the consumption price of a barrel of oil in 1970, 90.4% in 1980, 49.9% in 1998 and 75.4% in 2008. Furthermore world crude oil prices were only 14.8% of the consumption price of a barrel of oil in 1970. A weighted averaged of domestic and world crude oil prices suggests that in 1970 crude oil prices were only about one third of the consumption price of a barrel of oil in 1970.
September 12th, 2013 at 12:55 am PDT
link