
Welfare economics: inequality, production, and technology (part 3 of a series)
This is the third part of a series. See parts 1, 2, 4, and 5.
Last time, we concluded that output cannot be measured independently of distribution, “the size of the proverbial pie in fact depends upon how you slice it.” That’s a clear enough idea, but the example that we used to get there may have seemed forced. We invented people with divergent circumstances and preferences, and had a policy decision rather than “the free market” slice up the pie.
Now we’ll consider a more natural case, although still unnaturally oversimplified. Imagine an economy in which only two goods are produced, loaves of bread and swimming pools. Figure 1 below shows a “production possibilities frontier” for our economy.
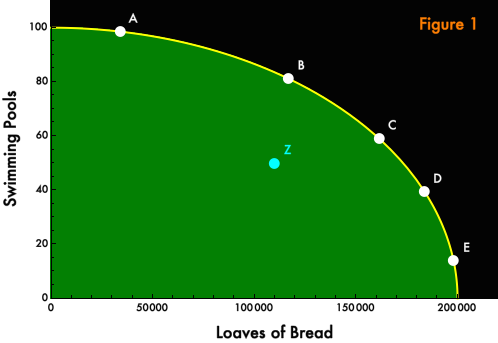
The yellow line represents locations of efficient production. Points A, B, C, D, and E, which sit upon that line, are “attainable”, and the production of no good can be increased without a corresponding decrease in the other good. Point Z is also attainable, but it is not efficient: by moving from Z to B or C, more of both goods could be made available. Assuming (as we generally have) that people prefer more goods to fewer (or that they have the option of “free disposal”), points B and C are plainly superior to point Z. However, from this diagram alone, there is no way to rank points A, B, C, D, and E. Is possibility A, which produces a lot of swimming pools but not so much bread, better or worse than possibility E, which bakes aplenty but builds pools just a few?
Under the usual (dangerous) assumptions of “base case” economics — perfect information, complete and competitive markets, no externalities — markets with profit-seeking firms will take us to somewhere on the production possibilities frontier. But precisely which point will depend upon the preferences of the people in our economy. How much bread do they require or desire? How much do they like to swim? How much do they value not having to share the pools that they swim in? Except in very special cases, which point will also depend upon the distribution of wealth among the people in our economy. Suppose that the poor value an additional loaf of bread much more than they value the option of privately swimming, while the rich have full bellies, and so allocate new wealth mostly towards personal swimming pools. Then if wealth is very concentrated, the market allocation will be dominated by the preferences of the wealthy, and we’ll end up at points A or B. If the distribution is more equal and few people are so sated they couldn’t do with more bread, we’ll find points D or E. All of the points represent potential market allocations — we needn’t posit any state or social planner to make the choice. But the choice will depend upon the wealth distribution.
Let’s try to understand this in terms of the diagrams we developed in the previous piece. We’ll contrast points A and E as representing different technologies. Don’t mistake this for different levels of technology. We are not talking about new scientific discoveries. By a “technology” we simply mean an arrangement of productive resources in the world. One technology might involve devoting a large share of productive resources to the construction of very efficient large-scale bakeries, while another might redirect those resources to the mining and mixing of the materials in concrete. Humans, whether via markets or other decision-making institutions, can choose either of these technologies without anyone having to invent things. (By happenstance, Paul Krugman drew precisely this distinction yesterday.)
Figure 2 shows a diagram of Technology A and Technology E in our two person (“Kaldor” and “Hicks”) economy.
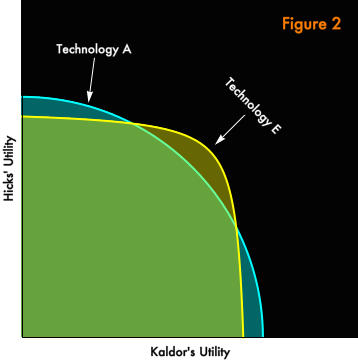
The two technologies are not rankable independently of distribution. I hope that this is intuitive from the diagram, but if it is not, read the previous post and then persuade yourself that the two orange points in Figure 3 below are subject to “Scitovsky reversals”. One can move from either orange point to the other, and it would be possible to compensate the “loser” for the change in a way that would leave both parties better off. So, by the potential Pareto criterion, each point is superior to the other, there is no well-defined ordering.

In contrast to our previous example of an unrankable change, Kaldor and Hicks here have identical and very natural preferences. Both devote most of their income to bread when they are poor but shift their allocation towards swimming pool construction as they grow rich. As a result, both prefer Technology A when the distribution of wealth is lopsided (the light blue points), while both prefer Technology E (the yellow point) when the distribution is very equal. It’s intuitive, I think, that whoever is rich prefers swimming-pool-centric Technology A. What may be surprising is that, if the wealth distribution is held constant, the choice of technology is always unanimous. If Hicks is rich and Kaldor is poor, even Kaldor prefers Technology A, because his meager share of the pie includes claims on swimming pools that he can offer to The Man in exchange for disproportionate quantities of bread.
This is more obvious if we consider an extreme. Suppose there were a technology that produced all bread and no swimming pools under a very unequal wealth distribution. Then, putting aside complications like altruism, whoever is rich eats a surfeit of bread that provides almost no satisfaction, and perhaps even throws away a large excess. The poor have nothing but bread to trade for bread, so there is no trade. They are stuck with no way to expand the small meals they are endowed with. But, add some swimming pools to the economy and give the poor a pro rata share of everything (i.e. define the initial distribution in terms of money), then all of a sudden the poor have something that the rich value, which they can exchange for excess bread that the rich value not at all. The rich are willing to surrender a lot of (useless to them) bread in exchange for even small claims on the swimming pools that they really want. When things are very unequal, the benefit to the poor of having something to trade exceeds the cost of an economy whose aggregate production is not well matched with their consumption. Aggregate production goes to the rich; the poor are in the business of maximizing their crumbs.
So, which organizations of resources, Technology A or Technology E, is “most efficient”, “maximizes the size of the pie”? There is no distribution-independent answer to that question. If the pie will be sliced up equally, then Technology E is superior. If the pie will be sliced up very unequally, then Technology A is superior. The size of the pie depends upon how you slice it, given very natural, very ordinary sorts of preferences. Patterns of resource utilization, of what gets produced and what does not, depend very much on the distribution of wealth within an economy. It’s not coherent to claim that economic arrangements are “more efficient” than they would be under some alternative distribution. If what you mean by “efficiency” is mere Pareto efficiency, there are Pareto-efficient outcomes consistent with any distribution. If you have a broader notion of economic efficiency in mind, then which arrangements are “most efficient” cannot be defined independently of the distribution of wealth.
I’ll end with a speculative thought experiment, about technological development. Remember, up until now, we’ve been considering alternative choices among already known technologies. Now let’s think about the relationship between distribution and the invention of new technologies. Consider Figure 4 below:
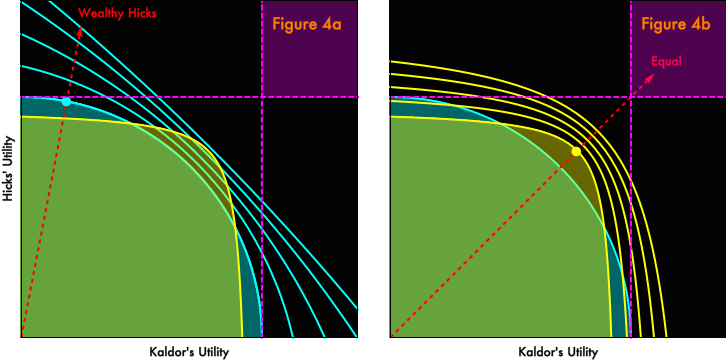
In our two-person economy, technological improvement shifts utility possibility curves outward, making it feasible for both individuals to increase their enjoyment without any tradeoff. In Figure 4, we have shown outward shifts from the two technologies that we considered above. Panel 4a shows incremental improvements on Technology A. Panel 4b shows incremental improvements on Technology E. Not all technological improvements are incremental, but most are, even most of what gets marketed as “revolutionary”. We assume, per the discussion above, that our economy chooses the distribution-dependent superior technology and iterates from that. We also assume that, absent political intervention, the deployment of new technology leaves the distribution of wealth pretty much unchanged. That may or may not be realistic, but it will serve as a useful base case for our thought experiment.
In both panels, after four iterative improvements, technological improvement dominates the choice of technologies in a rankable Kaldor-Hicks sense. After four rounds of technological change, regardless of which technology we started from, there is some distribution under the new technology that would be a Pareto improvement over any feasible distribution prior to the technological development. (My choice of four iterations is completely arbitrary; this is just an illustration.) If we assume that adoption of the new technology is accompanied by optimal social choice of distribution (however the “optimality” of that choice is defined), technological improvement quickly overwhelms the initial, distribution-dependent, choice of technology. A futurist, technoutopian view naturally follows: whatever sucks about now, technological change will undo it, overcome it.
But “optimal social choice of distribution” is a hard assumption to swallow. What if we suppose, more realistically, inertia — that there’s a great deal of status quo bias in distributive institutions, that the distribution after technology adoption remains similar to the distribution prior. Worse, but realistically, what if we imagine that distribution-preserving technological change and redistribution are perceived within political institutions as alternative means of addressing economically induced unhappiness and dissatisfaction, as substitutes rather than complements. Some voices hail “innovation” as the solution to problems like poverty and precarity, while other voices argue that redistribution, however contentious, represents a surer path.
Under what circumstances would distribution-preserving innovation dominate distributional conflict as a strategy for overcoming economic discontent? A straightforward criterion would be when technological change could yield outcomes better than any change in distributional arrangements or choice of status quo technologies. In Figure 4 (both panels), this dominant region is represented by the purple region northeast of the purple dashed lines.
Distribution-preserving innovation implies moving outward with technological change along the current “distribution ray”, represented by the red dashed line. Qualitatively, loosely, informally, the distance that one would have to travel along a distribution ray before intersecting with the dominant region is a measure of the plausibility of innovation as a universally acceptable alternative to distributional conflict. The shorter the distance from the status quo to the dominant technology region, the more attractive innovation, rather than distributional conflict, becomes for all parties. Conversely, if the distance from the status quo to a sure improvement is very long, one party is likely to find contesting distributive arrangements a more plausible strategy than supporting innovation.
In the right-hand panel of Figure 4, representing an equal current distribution, innovation along the distribution ray would pretty quickly reach the dominant region. Just a few more rounds than are shown and the yellow-dot status quo could travel along the red-dashed distribution ray to the purple promised land. But in the left-hand panel, where we start with a very unequal distribution, the distribution ray would not intersect the purple region for a long, long time, well beyond the top boundary of the figure. When the status quo is this unequal, innovation is unlikely to be a credible alternative to distributional conflict. In the limiting case of a perfectly unequal distribution, the distribution ray would sit at 90° (or 0°) and even infinite innovation would fail to intersect the redistribution-dominating region. For the status quo loser, no possible distribution-preserving innovation would be superior to contesting distributional arrangements.
For agents with similar preferences, more equal distributions will be “closer” to the dominant region for three reasons:
- perfect equality is “minimax“, that is it minimizes the maximum benefit achievable by either party from redistribution, reducing the attractiveness of distributive fights;
- under equality, for a given level of technology, the choice among available technologies will fall closer (or at least as close) to the dominant region as under less equal distributions, giving iterations from that choice a head start;
- the closest-in point of the dominant region (the point closest to the origin) sits on the equal-distribution ray, it is there that one finds the “lowest hanging fruit”. More unequal “distribution rays” point to ever more distant frontiers of the dominant region.
Note that there is a continuum, not a stark choice between perfectly equal and very unequal distributions. The more equal the distribution of wealth, the more attractive will be innovation as an alternative to distributive conflict. As the distribution of wealth becomes more unequal, distributive losers will come to perceive calls for innovation as a fig-leaf that distracts from a more contentious but superior strategy, while distributive winners will preach technoutopianism with ever greater fervor.
There’s lots to argue with in our little thought experiment. Technological change needn’t be distribution-preserving, innovation and redistribution needn’t be mutually exclusive priorities, the “distance” in our diagrams — in joint utility space along contours of technological change — may defy the Euclidean intuitions I’ve invited you to indulge. Nevertheless, I think there’s a consonance between our story and the current politics of technology and innovation. The best way to build a consensus in favor of innovation and technological development may be to address distributional issues that make cynics of potential enthusiasts.
Note: With continued apologies, comments remain closed until the completion of this series of posts on welfare economics. Please do write down your thoughts and save them! I think there will be two more posts, with comments finally open on the last.
Update History:
- 2-Jul-2014, 4:25 a.m. PDT: “other voices argue that redistribution, however
contentionscontentious, represents a surer path.”
[…] Continue Reading : Welfare economics: inequality, production, and technology (part 3 of a series) […]
June 13th, 2014 at 2:24 pm PDT
link